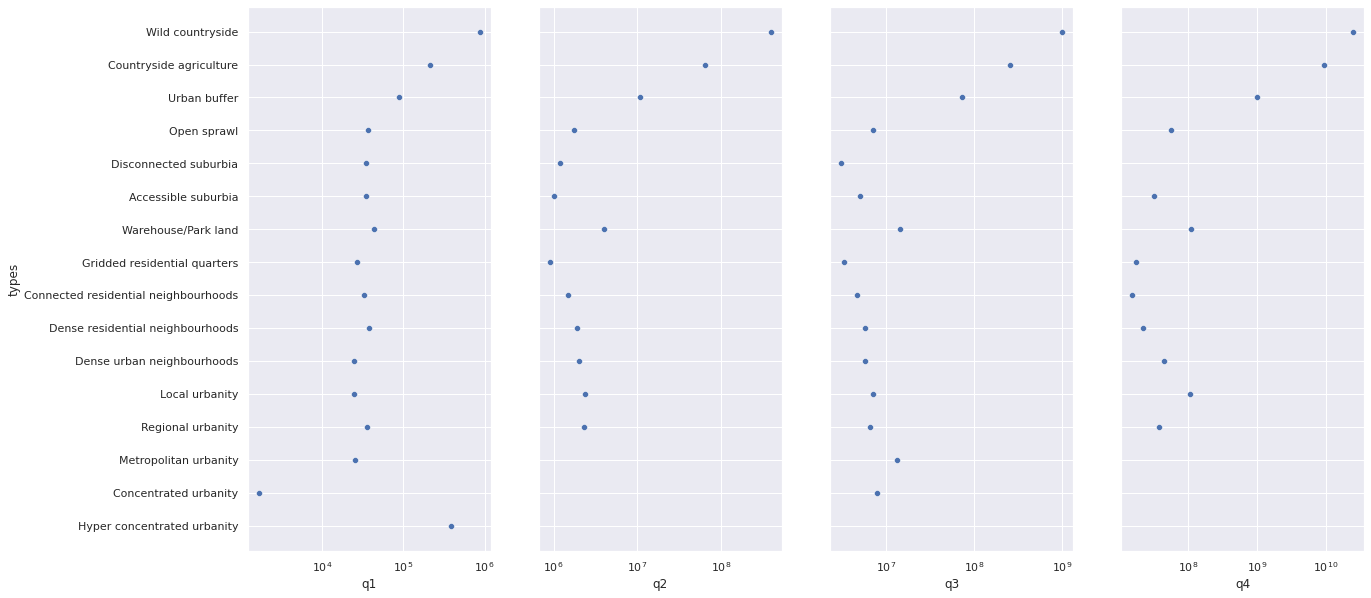
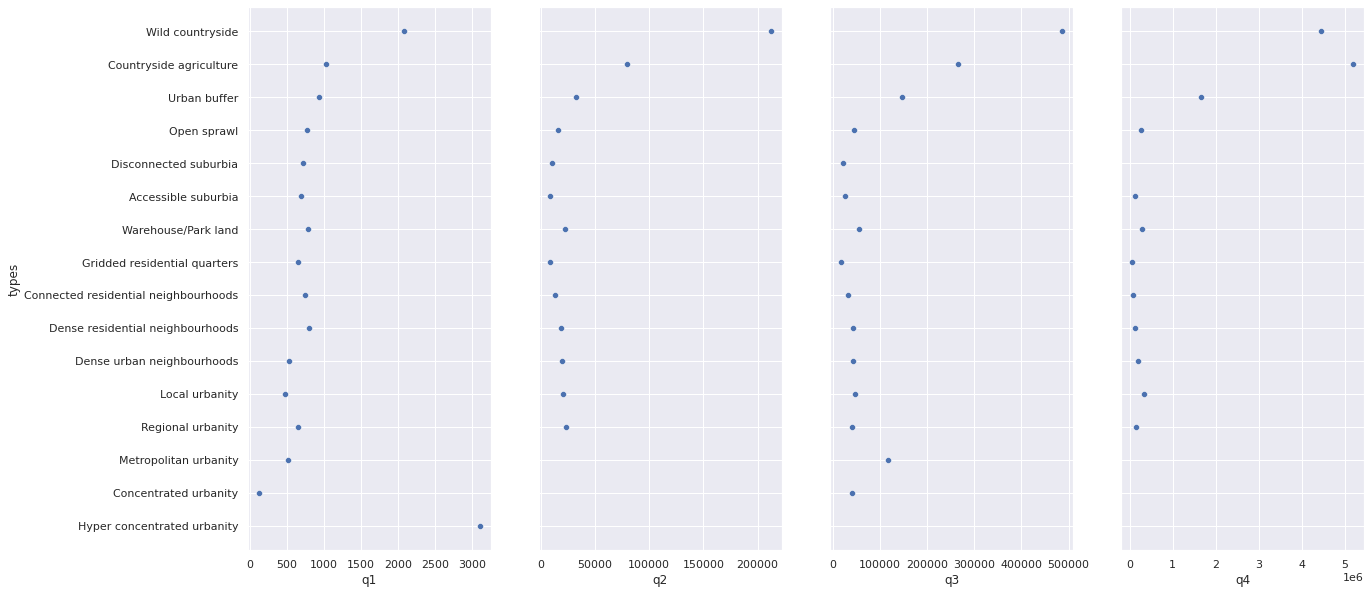
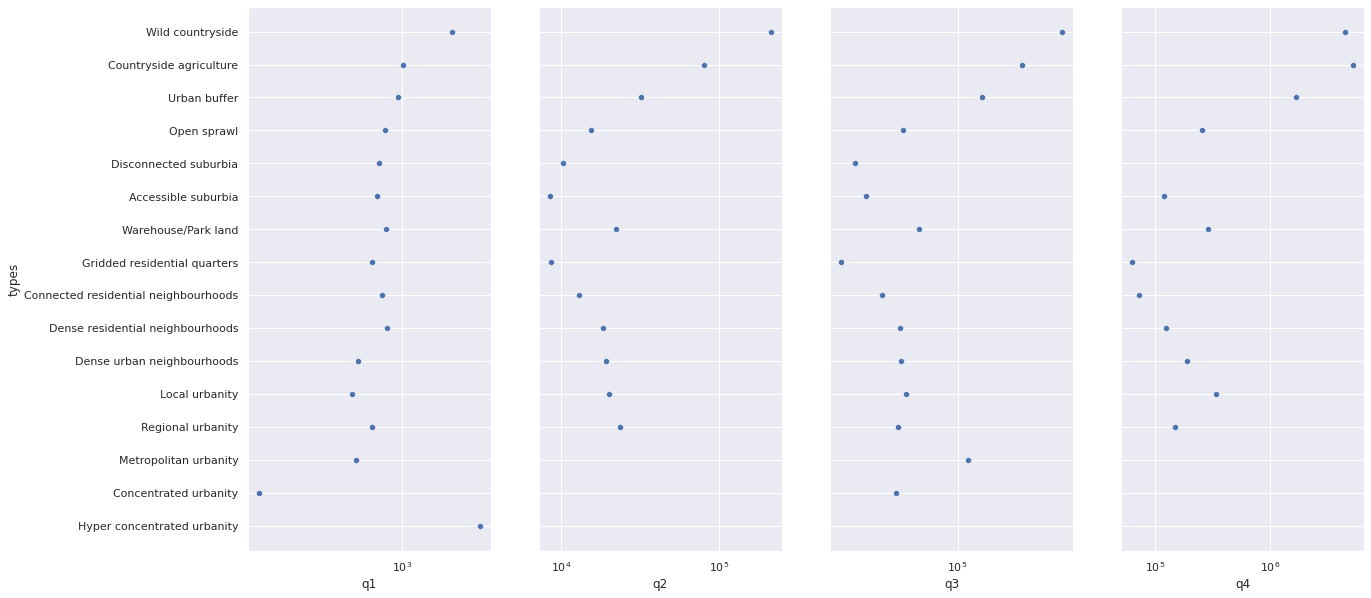
Size and shape of signatures
This notebook explores sizes and shapes of individual signatures depending on their signature type.
import geopandas
import pandas
import dask_geopandas
import momepy
import seaborn
import pygeos
import pandas
import numpy
import dask.dataframe
from dask.distributed import Client, LocalCluster
import matplotlib.pyplot as plt
from itertools import product
Measure size and shape characters
client = Client()
client
Client
|
Cluster
|
pygeos.__version__
'0.9'
signatures = dask_geopandas.from_geopandas(geopandas.read_parquet("../../urbangrammar_samba/spatial_signatures/signatures/signatures_combined_levels_orig.pq"), npartitions=32)
signatures
| kmeans10gb | geometry | level2 | signature_type | |
|---|---|---|---|---|
| npartitions=32 | ||||
| 0 | int64 | geometry | float64 | object |
| 3022 | ... | ... | ... | ... |
| ... | ... | ... | ... | ... |
| 93682 | ... | ... | ... | ... |
| 96703 | ... | ... | ... | ... |
signatures["area"] = signatures.area
signatures["perimeter"] = signatures.length
signatures["eri"] = signatures.map_partitions(lambda p: momepy.EquivalentRectangularIndex(p).series, meta=pandas.Series(dtype="float"))
signatures["circular_compactness"] = signatures.map_partitions(lambda p: momepy.CircularCompactness(p).series, meta=pandas.Series(dtype="float"))
signatures["donut_index"] = signatures.map_partitions(lambda p: momepy.CourtyardIndex(p, momepy.CourtyardArea(p).series).series, meta=pandas.Series(dtype="float"))
signatures["fractality"] = signatures.map_partitions(lambda p: momepy.FractalDimension(p).series, meta=pandas.Series(dtype="float"))
signatures["convexity"] = signatures.map_partitions(lambda p: momepy.Convexity(p).series, meta=pandas.Series(dtype="float"))
%%time
signatures = signatures.compute()
CPU times: user 12.8 s, sys: 5.15 s, total: 17.9 s
Wall time: 32.1 s
signatures.drop(columns=["kmeans10gb", "geometry", "level2"]).to_parquet("../../urbangrammar_samba/spatial_signatures/esda/sizeshape.pq")
<ipython-input-15-9c695be00e9b>:1: UserWarning: this is an initial implementation of Parquet/Feather file support and associated metadata.  This is tracking version 0.1.0 of the metadata specification at https://github.com/geopandas/geo-arrow-spec

This metadata specification does not yet make stability promises.  We do not yet recommend using this in a production setting unless you are able to rewrite your Parquet/Feather files.

To further ignore this warning, you can do:
import warnings; warnings.filterwarnings('ignore', message='.*initial implementation of Parquet.*')
  signatures.drop(columns=["kmeans10gb", "geometry", "level2"]).to_parquet("../../urbangrammar_samba/spatial_signatures/esda/sizeshape.pq")
signatures.drop(columns=["kmeans10gb", "geometry", "level2"]).to_csv("../../urbangrammar_samba/spatial_signatures/esda/sizeshape.csv")
Exploration of results
signatures = pandas.read_parquet("../../urbangrammar_samba/spatial_signatures/esda/sizeshape.pq")
types = {
    "0_0": "Countryside agriculture",
    "1_0": "Accessible suburbia",
    "3_0": "Open sprawl",
    "4_0": "Wild countryside",
    "5_0": "Warehouse/Park land",
    "6_0": "Gridded residential quarters",
    "7_0": "Urban buffer",
    "8_0": "Disconnected suburbia",
    "2_0": "Dense residential neighbourhoods",
    "2_1": "Connected residential neighbourhoods",
    "2_2": "Dense urban neighbourhoods",
    "9_0": "Local urbanity",
    "9_1": "Concentrated urbanity",
    "9_2": "Regional urbanity",
    "9_4": "Metropolitan urbanity",
    "9_5": "Hyper concentrated urbanity",
}

signatures["signature_type"] = signatures["signature_type"].map(types)
signatures
| signature_type | area | perimeter | eri | circular_compactness | donut_index | fractality | convexity | |
|---|---|---|---|---|---|---|---|---|
| 0 | Countryside agriculture | 1.826984e+07 | 29577.575163 | 0.601828 | 0.439852 | 0.000071 | 1.065559 | 0.788857 |
| 1 | Countryside agriculture | 1.235908e+04 | 555.207264 | 0.892662 | 0.254347 | 0.000000 | 1.047118 | 0.983245 |
| 2 | Countryside agriculture | 7.234542e+05 | 5746.792461 | 0.602136 | 0.339522 | 0.000000 | 1.077707 | 0.629428 |
| 3 | Countryside agriculture | 1.229467e+06 | 6161.670240 | 0.731125 | 0.306803 | 0.000000 | 1.046892 | 0.799648 |
| 4 | Countryside agriculture | 7.604014e+06 | 22500.262066 | 0.539593 | 0.252670 | 0.000281 | 1.089988 | 0.641429 |
| ... | ... | ... | ... | ... | ... | ... | ... | ... |
| 96699 | NaN | 4.070783e+04 | 824.963123 | 1.020075 | 0.453320 | 0.000000 | 1.004137 | 0.999224 |
| 96700 | NaN | 3.523702e+03 | 270.956057 | 0.959089 | 0.334764 | 0.000000 | 1.032331 | 0.995177 |
| 96701 | NaN | 1.236944e+05 | 1525.262336 | 1.017609 | 0.370246 | 0.000000 | 1.013789 | 0.965269 |
| 96702 | NaN | 1.526104e+03 | 189.735084 | 0.954954 | 0.277671 | 0.000000 | 1.052956 | 0.921173 |
| 96703 | NaN | 1.444304e+04 | 477.377607 | 1.026855 | 0.615717 | 0.000000 | 0.998544 | 0.999986 |
96704 rows × 8 columns
# drop outlier clusters
signatures = signatures.dropna()
order = [
    "Wild countryside",
    "Countryside agriculture",
    "Urban buffer",
    "Open sprawl",
    "Disconnected suburbia",
    "Accessible suburbia",
    "Warehouse/Park land",
    "Gridded residential quarters",
    "Connected residential neighbourhoods",
    "Dense residential neighbourhoods",
    "Dense urban neighbourhoods",
    "Local urbanity",
    "Regional urbanity",
    "Metropolitan urbanity",
    "Concentrated urbanity",
    "Hyper concentrated urbanity",
]

signatures["signature_type"] = pandas.Categorical(signatures["signature_type"], categories=order, ordered=True)
<ipython-input-6-955dbae783e0>:20: SettingWithCopyWarning:
A value is trying to be set on a copy of a slice from a DataFrame.
Try using .loc[row_indexer,col_indexer] = value instead

See the caveats in the documentation: https://pandas.pydata.org/pandas-docs/stable/user_guide/indexing.html#returning-a-view-versus-a-copy
  signatures["signature_type"] = pandas.Categorical(signatures["signature_type"], categories=order, ordered=True)
grouped = signatures.groupby("signature_type").describe()
grouped
| area | perimeter | ... | fractality | convexity | |||||||||||||||||
|---|---|---|---|---|---|---|---|---|---|---|---|---|---|---|---|---|---|---|---|---|---|
| count | mean | std | min | 25% | 50% | 75% | max | count | mean | ... | 75% | max | count | mean | std | min | 25% | 50% | 75% | max | |
| signature_type | |||||||||||||||||||||
| Wild countryside | 6214.0 | 1.469363e+07 | 5.997410e+08 | 0.057032 | 1499.198526 | 6508.082021 | 45560.114847 | 3.944223e+10 | 6214.0 | 5262.662128 | ... | 1.087244 | 6.436920 | 6214.0 | 0.847012 | 0.144665 | 0.171730 | 0.749014 | 0.897610 | 0.967863 | 1.000000 |
| Countryside agriculture | 10882.0 | 8.624893e+06 | 7.140831e+08 | 0.000150 | 955.663816 | 3089.140723 | 15668.089578 | 7.438020e+10 | 10882.0 | 6103.812918 | ... | 1.088969 | 13.445506 | 10882.0 | 0.850269 | 0.143361 | 0.174666 | 0.756614 | 0.902827 | 0.966824 | 1.000000 |
| Urban buffer | 10636.0 | 2.969990e+06 | 6.339222e+07 | 0.000879 | 774.805352 | 3084.529241 | 27159.387001 | 4.103858e+09 | 10636.0 | 6339.599043 | ... | 1.088700 | 17.908917 | 10636.0 | 0.851529 | 0.138671 | 0.206889 | 0.754072 | 0.900720 | 0.966431 | 1.000000 |
| Open sprawl | 17357.0 | 2.927622e+05 | 3.818980e+06 | 0.000160 | 643.323344 | 1612.151800 | 9317.120739 | 3.672014e+08 | 17357.0 | 2309.238110 | ... | 1.101593 | 268.246039 | 17357.0 | 0.820230 | 0.159341 | 0.209074 | 0.708346 | 0.878782 | 0.953845 | 1.000000 |
| Disconnected suburbia | 9418.0 | 7.528544e+04 | 3.305071e+05 | 0.001150 | 616.810183 | 1447.681618 | 8060.213460 | 9.032649e+06 | 9418.0 | 1017.207867 | ... | 1.091667 | 4.022005 | 9418.0 | 0.843098 | 0.132009 | 0.292148 | 0.740525 | 0.888421 | 0.957065 | 1.000000 |
| Accessible suburbia | 10919.0 | 2.055632e+05 | 1.280101e+06 | 0.009560 | 588.376394 | 1507.000971 | 18570.817476 | 5.079366e+07 | 10919.0 | 1627.488939 | ... | 1.090873 | 5.549176 | 10919.0 | 0.844585 | 0.123035 | 0.375821 | 0.753064 | 0.877346 | 0.951271 | 1.000000 |
| Warehouse/Park land | 10675.0 | 2.306844e+05 | 3.414580e+06 | 0.016327 | 732.048897 | 1865.205005 | 8534.309518 | 2.257328e+08 | 10675.0 | 1484.178936 | ... | 1.095447 | 3.629490 | 10675.0 | 0.833803 | 0.152972 | 0.216611 | 0.718129 | 0.894513 | 0.962252 | 1.000000 |
| Gridded residential quarters | 2561.0 | 1.020215e+05 | 5.970954e+05 | 0.003155 | 510.032001 | 1176.434329 | 6925.344211 | 1.790986e+07 | 2561.0 | 1101.256942 | ... | 1.087953 | 1.630874 | 2561.0 | 0.864575 | 0.121242 | 0.342705 | 0.775185 | 0.906935 | 0.968370 | 1.000000 |
| Connected residential neighbourhoods | 5802.0 | 9.745088e+04 | 6.036783e+05 | 0.485844 | 644.482072 | 1501.473957 | 7804.156901 | 1.960757e+07 | 5802.0 | 1211.006013 | ... | 1.093833 | 4.665447 | 5802.0 | 0.838442 | 0.145711 | 0.268105 | 0.729141 | 0.892645 | 0.962229 | 1.000000 |
| Dense residential neighbourhoods | 6815.0 | 1.404605e+05 | 1.047595e+06 | 0.000205 | 649.122630 | 1617.513549 | 6993.079521 | 4.613231e+07 | 6815.0 | 1572.557494 | ... | 1.091611 | 5.789690 | 6815.0 | 0.843006 | 0.149689 | 0.267939 | 0.739355 | 0.902421 | 0.964749 | 1.000000 |
| Dense urban neighbourhoods | 3344.0 | 1.706542e+05 | 3.442472e+06 | 0.099989 | 532.894544 | 1272.170461 | 4448.501438 | 1.930257e+08 | 3344.0 | 1400.642709 | ... | 1.072876 | 3.028465 | 3344.0 | 0.873944 | 0.132032 | 0.239345 | 0.792542 | 0.929865 | 0.977628 | 1.000000 |
| Local urbanity | 1598.0 | 1.446739e+05 | 2.727705e+06 | 0.307900 | 501.241702 | 1324.764741 | 4277.220397 | 1.071213e+08 | 1598.0 | 1092.282020 | ... | 1.068875 | 5.857685 | 1598.0 | 0.888981 | 0.124262 | 0.369595 | 0.817659 | 0.944655 | 0.983643 | 1.000000 |
| Regional urbanity | 316.0 | 2.419051e+05 | 2.256797e+06 | 0.041376 | 492.984923 | 1230.743132 | 3552.061623 | 3.865336e+07 | 316.0 | 1803.643697 | ... | 1.070887 | 3.260720 | 316.0 | 0.894825 | 0.133988 | 0.128971 | 0.836158 | 0.951919 | 0.987714 | 1.000000 |
| Metropolitan urbanity | 135.0 | 1.228652e+05 | 1.138579e+06 | 0.269200 | 356.672983 | 1030.773091 | 3819.015313 | 1.318199e+07 | 135.0 | 1375.312753 | ... | 1.085932 | 4.011579 | 135.0 | 0.920512 | 0.112035 | 0.476495 | 0.900620 | 0.966404 | 0.994193 | 1.000000 |
| Concentrated urbanity | 11.0 | 7.167404e+05 | 2.371545e+06 | 3.496111 | 218.266828 | 349.147183 | 1527.810889 | 7.867210e+06 | 11.0 | 3700.784089 | ... | 1.090851 | 2.924473 | 11.0 | 0.934777 | 0.100749 | 0.654358 | 0.929441 | 0.970923 | 0.990041 | 0.999957 |
| Hyper concentrated urbanity | 6.0 | 3.823119e+05 | 5.858664e+05 | 1797.907262 | 2096.072097 | 15499.678131 | 747712.533029 | 1.271663e+06 | 6.0 | 3097.160016 | ... | 1.096803 | 1.125311 | 6.0 | 0.869961 | 0.142417 | 0.625078 | 0.824920 | 0.896392 | 0.977088 | 0.996822 |
16 rows × 56 columns
seaborn.set_theme(style="darkgrid")
Area
fig, ax = plt.subplots(figsize=(12, 12))
seaborn.boxenplot(x="signature_type", y='area', hue='signature_type', dodge=False, data=signatures, ax=ax, showfliers=False, linewidth=.75)
ax.set_yscale("log")
ax.legend_.remove()
plt.xticks(rotation=90)
(array([ 0,  1,  2,  3,  4,  5,  6,  7,  8,  9, 10, 11, 12, 13, 14, 15]),
 [Text(0, 0, 'Wild countryside'),
  Text(1, 0, 'Countryside agriculture'),
  Text(2, 0, 'Urban buffer'),
  Text(3, 0, 'Open sprawl'),
  Text(4, 0, 'Disconnected suburbia'),
  Text(5, 0, 'Accessible suburbia'),
  Text(6, 0, 'Warehouse/Park land'),
  Text(7, 0, 'Gridded residential quarters'),
  Text(8, 0, 'Connected residential neighbourhoods'),
  Text(9, 0, 'Dense residential neighbourhoods'),
  Text(10, 0, 'Dense urban neighbourhoods'),
  Text(11, 0, 'Local urbanity'),
  Text(12, 0, 'Regional urbanity'),
  Text(13, 0, 'Metropolitan urbanity'),
  Text(14, 0, 'Concentrated urbanity'),
  Text(15, 0, 'Hyper concentrated urbanity')])
g = seaborn.PairGrid(grouped["area"].reset_index(),
                 x_vars=grouped["area"].columns[1:], y_vars=["signature_type"],
                 height=10, aspect=.25)
g.map(seaborn.stripplot, size=10, orient="h", jitter=False,
      linewidth=1, edgecolor="w")
seaborn.despine(left=True, bottom=True)
g = seaborn.PairGrid(grouped["area"].reset_index(),
                 x_vars=grouped["area"].columns[1:], y_vars=["signature_type"],
                 height=10, aspect=.25)
g.map(seaborn.stripplot, size=10, orient="h", jitter=False,
      linewidth=1, edgecolor="w")
g.set(xscale='log')
seaborn.despine(left=True, bottom=True)
Perimeter
fig, ax = plt.subplots(figsize=(12, 12))
seaborn.boxenplot(x="signature_type", y='perimeter', hue='signature_type', dodge=False, data=signatures, ax=ax, showfliers=False, linewidth=.75)
ax.set_yscale("log")
ax.legend_.remove()
plt.xticks(rotation=90)
(array([ 0,  1,  2,  3,  4,  5,  6,  7,  8,  9, 10, 11, 12, 13, 14, 15]),
 [Text(0, 0, 'Wild countryside'),
  Text(1, 0, 'Countryside agriculture'),
  Text(2, 0, 'Urban buffer'),
  Text(3, 0, 'Open sprawl'),
  Text(4, 0, 'Disconnected suburbia'),
  Text(5, 0, 'Accessible suburbia'),
  Text(6, 0, 'Warehouse/Park land'),
  Text(7, 0, 'Gridded residential quarters'),
  Text(8, 0, 'Connected residential neighbourhoods'),
  Text(9, 0, 'Dense residential neighbourhoods'),
  Text(10, 0, 'Dense urban neighbourhoods'),
  Text(11, 0, 'Local urbanity'),
  Text(12, 0, 'Regional urbanity'),
  Text(13, 0, 'Metropolitan urbanity'),
  Text(14, 0, 'Concentrated urbanity'),
  Text(15, 0, 'Hyper concentrated urbanity')])
g = seaborn.PairGrid(grouped["perimeter"].reset_index(),
                 x_vars=grouped["perimeter"].columns[1:], y_vars=["signature_type"],
                 height=10, aspect=.25)
g.map(seaborn.stripplot, size=10, orient="h", jitter=False,
      linewidth=1, edgecolor="w")
seaborn.despine(left=True, bottom=True)
g = seaborn.PairGrid(grouped["perimeter"].reset_index(),
                 x_vars=grouped["perimeter"].columns[1:], y_vars=["signature_type"],
                 height=10, aspect=.25)
g.map(seaborn.stripplot, size=10, orient="h", jitter=False,
      linewidth=1, edgecolor="w")
g.set(xscale='log')
seaborn.despine(left=True, bottom=True)
ERI
fig, ax = plt.subplots(figsize=(12, 12))
seaborn.boxenplot(x="signature_type", y='eri', hue='signature_type', dodge=False, data=signatures, ax=ax, showfliers=False, linewidth=.75)
ax.legend_.remove()
plt.xticks(rotation=90)
(array([ 0,  1,  2,  3,  4,  5,  6,  7,  8,  9, 10, 11, 12, 13, 14, 15]),
 [Text(0, 0, 'Wild countryside'),
  Text(1, 0, 'Countryside agriculture'),
  Text(2, 0, 'Urban buffer'),
  Text(3, 0, 'Open sprawl'),
  Text(4, 0, 'Disconnected suburbia'),
  Text(5, 0, 'Accessible suburbia'),
  Text(6, 0, 'Warehouse/Park land'),
  Text(7, 0, 'Gridded residential quarters'),
  Text(8, 0, 'Connected residential neighbourhoods'),
  Text(9, 0, 'Dense residential neighbourhoods'),
  Text(10, 0, 'Dense urban neighbourhoods'),
  Text(11, 0, 'Local urbanity'),
  Text(12, 0, 'Regional urbanity'),
  Text(13, 0, 'Metropolitan urbanity'),
  Text(14, 0, 'Concentrated urbanity'),
  Text(15, 0, 'Hyper concentrated urbanity')])
g = seaborn.PairGrid(grouped["eri"].reset_index(),
                 x_vars=grouped["eri"].columns[1:], y_vars=["signature_type"],
                 height=10, aspect=.25)
g.map(seaborn.stripplot, size=10, orient="h", jitter=False,
      linewidth=1, edgecolor="w")
seaborn.despine(left=True, bottom=True)
Circlular compactness
fig, ax = plt.subplots(figsize=(12, 12))
seaborn.boxenplot(x="signature_type", y='circular_compactness', hue='signature_type', dodge=False, data=signatures, ax=ax, showfliers=False, linewidth=.75)
ax.legend_.remove()
plt.xticks(rotation=90)
(array([ 0,  1,  2,  3,  4,  5,  6,  7,  8,  9, 10, 11, 12, 13, 14, 15]),
 [Text(0, 0, 'Wild countryside'),
  Text(1, 0, 'Countryside agriculture'),
  Text(2, 0, 'Urban buffer'),
  Text(3, 0, 'Open sprawl'),
  Text(4, 0, 'Disconnected suburbia'),
  Text(5, 0, 'Accessible suburbia'),
  Text(6, 0, 'Warehouse/Park land'),
  Text(7, 0, 'Gridded residential quarters'),
  Text(8, 0, 'Connected residential neighbourhoods'),
  Text(9, 0, 'Dense residential neighbourhoods'),
  Text(10, 0, 'Dense urban neighbourhoods'),
  Text(11, 0, 'Local urbanity'),
  Text(12, 0, 'Regional urbanity'),
  Text(13, 0, 'Metropolitan urbanity'),
  Text(14, 0, 'Concentrated urbanity'),
  Text(15, 0, 'Hyper concentrated urbanity')])
g = seaborn.PairGrid(grouped["circular_compactness"].reset_index(),
                 x_vars=grouped["circular_compactness"].columns[1:], y_vars=["signature_type"],
                 height=10, aspect=.25)
g.map(seaborn.stripplot, size=10, orient="h", jitter=False,
      linewidth=1, edgecolor="w")
seaborn.despine(left=True, bottom=True)
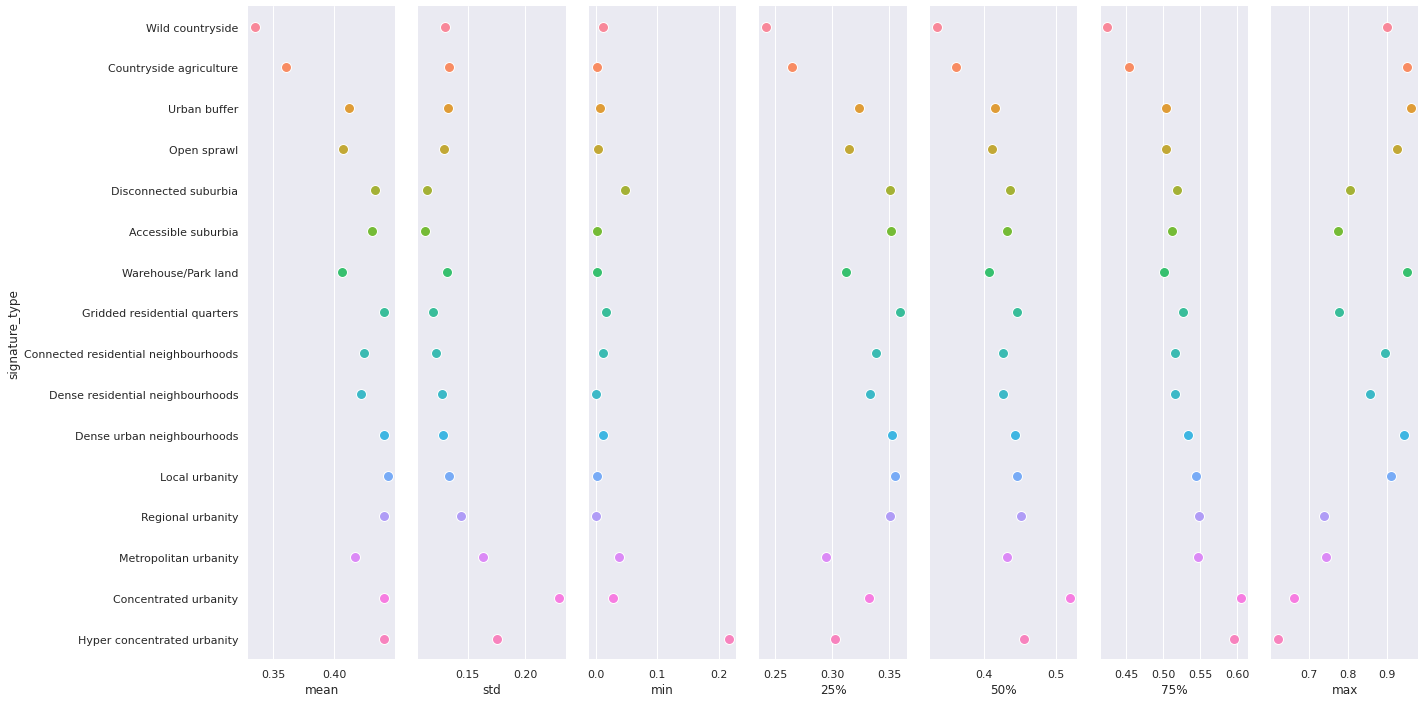
Donut index
fig, ax = plt.subplots(figsize=(12, 12))
seaborn.boxenplot(x="signature_type", y='donut_index', hue='signature_type', dodge=False, data=signatures, ax=ax, showfliers=False, linewidth=.75)
ax.legend_.remove()
plt.xticks(rotation=90)
(array([ 0,  1,  2,  3,  4,  5,  6,  7,  8,  9, 10, 11, 12, 13, 14, 15]),
 [Text(0, 0, 'Wild countryside'),
  Text(1, 0, 'Countryside agriculture'),
  Text(2, 0, 'Urban buffer'),
  Text(3, 0, 'Open sprawl'),
  Text(4, 0, 'Disconnected suburbia'),
  Text(5, 0, 'Accessible suburbia'),
  Text(6, 0, 'Warehouse/Park land'),
  Text(7, 0, 'Gridded residential quarters'),
  Text(8, 0, 'Connected residential neighbourhoods'),
  Text(9, 0, 'Dense residential neighbourhoods'),
  Text(10, 0, 'Dense urban neighbourhoods'),
  Text(11, 0, 'Local urbanity'),
  Text(12, 0, 'Regional urbanity'),
  Text(13, 0, 'Metropolitan urbanity'),
  Text(14, 0, 'Concentrated urbanity'),
  Text(15, 0, 'Hyper concentrated urbanity')])
g = seaborn.PairGrid(grouped["donut_index"].reset_index(),
                 x_vars=grouped["donut_index"].columns[1:], y_vars=["signature_type"],
                 height=10, aspect=.25)
g.map(seaborn.stripplot, size=10, orient="h", jitter=False,
      linewidth=1, edgecolor="w")
seaborn.despine(left=True, bottom=True)
Fractality
fig, ax = plt.subplots(figsize=(12, 12))
seaborn.boxenplot(x="signature_type", y='fractality', hue='signature_type', dodge=False, data=signatures, ax=ax, showfliers=False, linewidth=.75)
ax.legend_.remove()
plt.xticks(rotation=90)
(array([ 0,  1,  2,  3,  4,  5,  6,  7,  8,  9, 10, 11, 12, 13, 14, 15]),
 [Text(0, 0, 'Wild countryside'),
  Text(1, 0, 'Countryside agriculture'),
  Text(2, 0, 'Urban buffer'),
  Text(3, 0, 'Open sprawl'),
  Text(4, 0, 'Disconnected suburbia'),
  Text(5, 0, 'Accessible suburbia'),
  Text(6, 0, 'Warehouse/Park land'),
  Text(7, 0, 'Gridded residential quarters'),
  Text(8, 0, 'Connected residential neighbourhoods'),
  Text(9, 0, 'Dense residential neighbourhoods'),
  Text(10, 0, 'Dense urban neighbourhoods'),
  Text(11, 0, 'Local urbanity'),
  Text(12, 0, 'Regional urbanity'),
  Text(13, 0, 'Metropolitan urbanity'),
  Text(14, 0, 'Concentrated urbanity'),
  Text(15, 0, 'Hyper concentrated urbanity')])
g = seaborn.PairGrid(grouped["fractality"].reset_index(),
                 x_vars=grouped["fractality"].columns[1:], y_vars=["signature_type"],
                 height=10, aspect=.25)
g.map(seaborn.stripplot, size=10, orient="h", jitter=False,
      linewidth=1, edgecolor="w")
seaborn.despine(left=True, bottom=True)
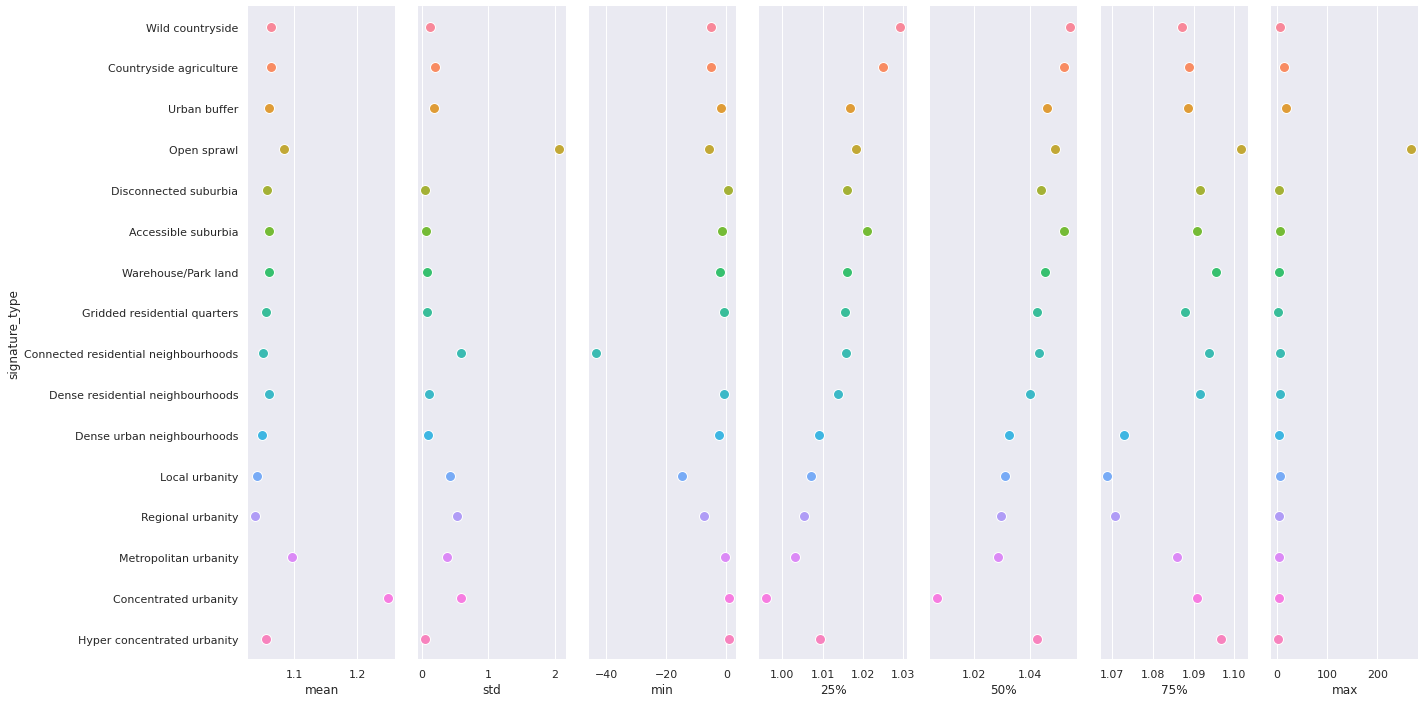
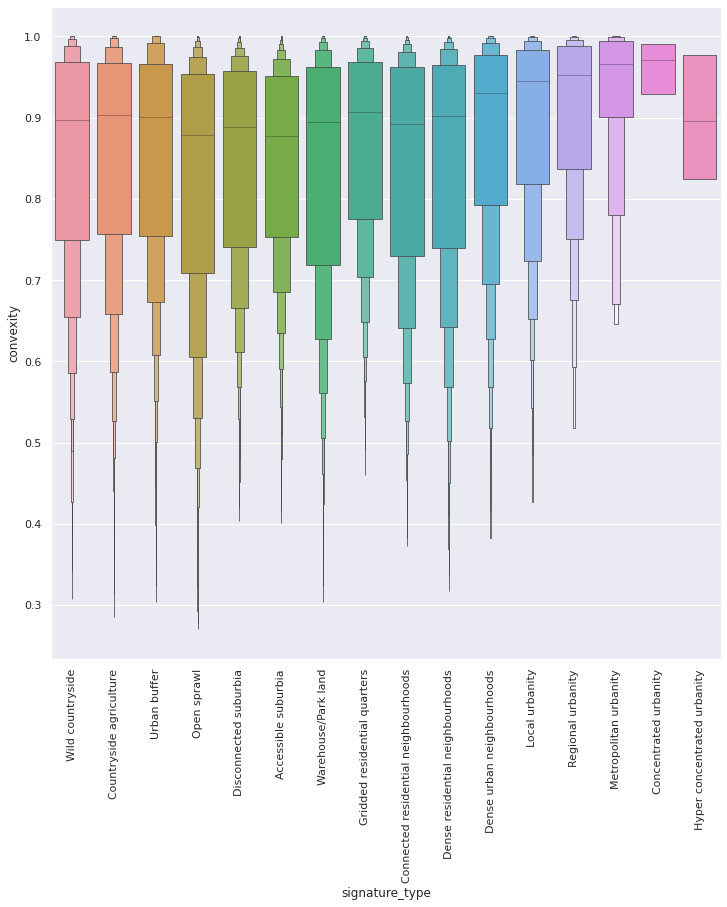
Convexity
fig, ax = plt.subplots(figsize=(12, 12))
seaborn.boxenplot(x="signature_type", y='convexity', hue='signature_type', dodge=False, data=signatures, ax=ax, showfliers=False, linewidth=.75)
ax.legend_.remove()
plt.xticks(rotation=90)
(array([ 0,  1,  2,  3,  4,  5,  6,  7,  8,  9, 10, 11, 12, 13, 14, 15]),
 [Text(0, 0, 'Wild countryside'),
  Text(1, 0, 'Countryside agriculture'),
  Text(2, 0, 'Urban buffer'),
  Text(3, 0, 'Open sprawl'),
  Text(4, 0, 'Disconnected suburbia'),
  Text(5, 0, 'Accessible suburbia'),
  Text(6, 0, 'Warehouse/Park land'),
  Text(7, 0, 'Gridded residential quarters'),
  Text(8, 0, 'Connected residential neighbourhoods'),
  Text(9, 0, 'Dense residential neighbourhoods'),
  Text(10, 0, 'Dense urban neighbourhoods'),
  Text(11, 0, 'Local urbanity'),
  Text(12, 0, 'Regional urbanity'),
  Text(13, 0, 'Metropolitan urbanity'),
  Text(14, 0, 'Concentrated urbanity'),
  Text(15, 0, 'Hyper concentrated urbanity')])
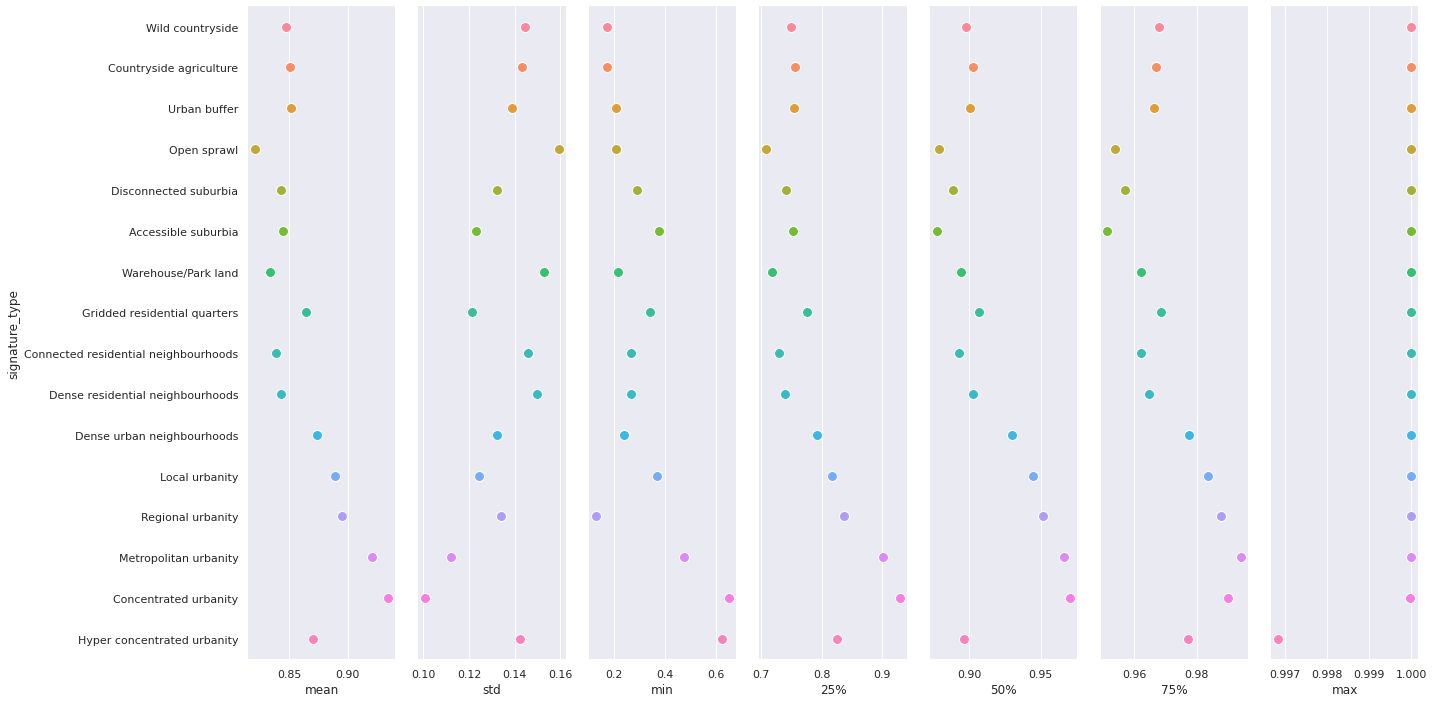
g = seaborn.PairGrid(grouped["convexity"].reset_index(),
                 x_vars=grouped["convexity"].columns[1:], y_vars=["signature_type"],
                 height=10, aspect=.25)
g.map(seaborn.stripplot, size=10, orient="h", jitter=False,
      linewidth=1, edgecolor="w")
seaborn.despine(left=True, bottom=True)
Using only 50% largest signatures per each type
The rationale is that it eliminates the “noise”.
mask = pandas.Series(numpy.zeros(len(signatures), dtype=bool), index=signatures.index)

for cl in signatures.signature_type.unique():
    sub = signatures[signatures.signature_type == cl]
    mean = sub.area.mean()
    above = sub.area > mean
    mask[above[above].index] = True
mask.sum()
6915
significant = signatures[mask]
significant_grouped = significant.groupby("signature_type").describe()
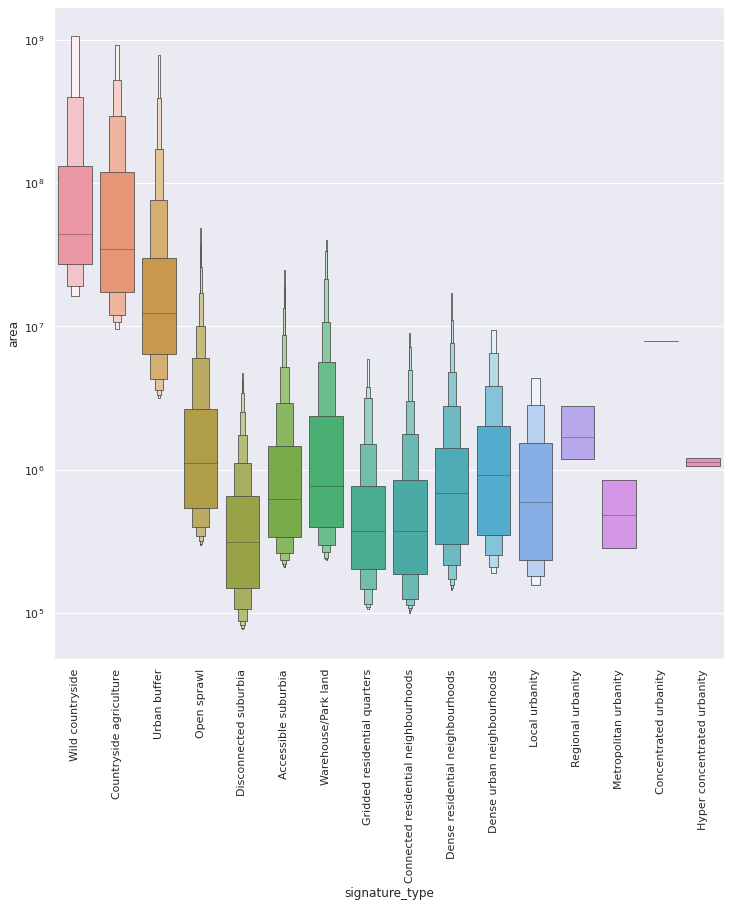
Area
fig, ax = plt.subplots(figsize=(12, 12))
seaborn.boxenplot(x="signature_type", y='area', hue='signature_type', dodge=False, data=significant, ax=ax, showfliers=False, linewidth=.75)
ax.set_yscale("log")
ax.legend_.remove()
plt.xticks(rotation=90)
(array([ 0,  1,  2,  3,  4,  5,  6,  7,  8,  9, 10, 11, 12, 13, 14, 15]),
 [Text(0, 0, 'Wild countryside'),
  Text(1, 0, 'Countryside agriculture'),
  Text(2, 0, 'Urban buffer'),
  Text(3, 0, 'Open sprawl'),
  Text(4, 0, 'Disconnected suburbia'),
  Text(5, 0, 'Accessible suburbia'),
  Text(6, 0, 'Warehouse/Park land'),
  Text(7, 0, 'Gridded residential quarters'),
  Text(8, 0, 'Connected residential neighbourhoods'),
  Text(9, 0, 'Dense residential neighbourhoods'),
  Text(10, 0, 'Dense urban neighbourhoods'),
  Text(11, 0, 'Local urbanity'),
  Text(12, 0, 'Regional urbanity'),
  Text(13, 0, 'Metropolitan urbanity'),
  Text(14, 0, 'Concentrated urbanity'),
  Text(15, 0, 'Hyper concentrated urbanity')])
g = seaborn.PairGrid(significant_grouped["area"].reset_index(),
                 x_vars=significant_grouped["area"].columns[1:], y_vars=["signature_type"],
                 height=10, aspect=.25)
g.map(seaborn.stripplot, size=10, orient="h", jitter=False,
      linewidth=1, edgecolor="w")
seaborn.despine(left=True, bottom=True)
g = seaborn.PairGrid(significant_grouped["area"].reset_index(),
                 x_vars=significant_grouped["area"].columns[1:], y_vars=["signature_type"],
                 height=10, aspect=.25)
g.map(seaborn.stripplot, size=10, orient="h", jitter=False,
      linewidth=1, edgecolor="w")
g.set(xscale='log')
seaborn.despine(left=True, bottom=True)
Perimeter
fig, ax = plt.subplots(figsize=(12, 12))
seaborn.boxenplot(x="signature_type", y='perimeter', hue='signature_type', dodge=False, data=significant, ax=ax, showfliers=False, linewidth=.75)
ax.set_yscale("log")
ax.legend_.remove()
plt.xticks(rotation=90)
(array([ 0,  1,  2,  3,  4,  5,  6,  7,  8,  9, 10, 11, 12, 13, 14, 15]),
 [Text(0, 0, 'Wild countryside'),
  Text(1, 0, 'Countryside agriculture'),
  Text(2, 0, 'Urban buffer'),
  Text(3, 0, 'Open sprawl'),
  Text(4, 0, 'Disconnected suburbia'),
  Text(5, 0, 'Accessible suburbia'),
  Text(6, 0, 'Warehouse/Park land'),
  Text(7, 0, 'Gridded residential quarters'),
  Text(8, 0, 'Connected residential neighbourhoods'),
  Text(9, 0, 'Dense residential neighbourhoods'),
  Text(10, 0, 'Dense urban neighbourhoods'),
  Text(11, 0, 'Local urbanity'),
  Text(12, 0, 'Regional urbanity'),
  Text(13, 0, 'Metropolitan urbanity'),
  Text(14, 0, 'Concentrated urbanity'),
  Text(15, 0, 'Hyper concentrated urbanity')])
g = seaborn.PairGrid(significant_grouped["perimeter"].reset_index(),
                 x_vars=significant_grouped["perimeter"].columns[1:], y_vars=["signature_type"],
                 height=10, aspect=.25)
g.map(seaborn.stripplot, size=10, orient="h", jitter=False,
      linewidth=1, edgecolor="w")
seaborn.despine(left=True, bottom=True)
g = seaborn.PairGrid(significant_grouped["perimeter"].reset_index(),
                 x_vars=significant_grouped["perimeter"].columns[1:], y_vars=["signature_type"],
                 height=10, aspect=.25)
g.map(seaborn.stripplot, size=10, orient="h", jitter=False,
      linewidth=1, edgecolor="w")
g.set(xscale='log')
seaborn.despine(left=True, bottom=True)
ERI
fig, ax = plt.subplots(figsize=(12, 12))
seaborn.boxenplot(x="signature_type", y='eri', hue='signature_type', dodge=False, data=significant, ax=ax, showfliers=False, linewidth=.75)
ax.legend_.remove()
plt.xticks(rotation=90)
(array([ 0,  1,  2,  3,  4,  5,  6,  7,  8,  9, 10, 11, 12, 13, 14, 15]),
 [Text(0, 0, 'Wild countryside'),
  Text(1, 0, 'Countryside agriculture'),
  Text(2, 0, 'Urban buffer'),
  Text(3, 0, 'Open sprawl'),
  Text(4, 0, 'Disconnected suburbia'),
  Text(5, 0, 'Accessible suburbia'),
  Text(6, 0, 'Warehouse/Park land'),
  Text(7, 0, 'Gridded residential quarters'),
  Text(8, 0, 'Connected residential neighbourhoods'),
  Text(9, 0, 'Dense residential neighbourhoods'),
  Text(10, 0, 'Dense urban neighbourhoods'),
  Text(11, 0, 'Local urbanity'),
  Text(12, 0, 'Regional urbanity'),
  Text(13, 0, 'Metropolitan urbanity'),
  Text(14, 0, 'Concentrated urbanity'),
  Text(15, 0, 'Hyper concentrated urbanity')])
g = seaborn.PairGrid(significant_grouped["eri"].reset_index(),
                 x_vars=significant_grouped["eri"].columns[1:], y_vars=["signature_type"],
                 height=10, aspect=.25)
g.map(seaborn.stripplot, size=10, orient="h", jitter=False,
      linewidth=1, edgecolor="w")
seaborn.despine(left=True, bottom=True)
Circlular compactness
fig, ax = plt.subplots(figsize=(12, 12))
seaborn.boxenplot(x="signature_type", y='circular_compactness', hue='signature_type', dodge=False, data=significant, ax=ax, showfliers=False, linewidth=.75)
ax.legend_.remove()
plt.xticks(rotation=90)
(array([ 0,  1,  2,  3,  4,  5,  6,  7,  8,  9, 10, 11, 12, 13, 14, 15]),
 [Text(0, 0, 'Wild countryside'),
  Text(1, 0, 'Countryside agriculture'),
  Text(2, 0, 'Urban buffer'),
  Text(3, 0, 'Open sprawl'),
  Text(4, 0, 'Disconnected suburbia'),
  Text(5, 0, 'Accessible suburbia'),
  Text(6, 0, 'Warehouse/Park land'),
  Text(7, 0, 'Gridded residential quarters'),
  Text(8, 0, 'Connected residential neighbourhoods'),
  Text(9, 0, 'Dense residential neighbourhoods'),
  Text(10, 0, 'Dense urban neighbourhoods'),
  Text(11, 0, 'Local urbanity'),
  Text(12, 0, 'Regional urbanity'),
  Text(13, 0, 'Metropolitan urbanity'),
  Text(14, 0, 'Concentrated urbanity'),
  Text(15, 0, 'Hyper concentrated urbanity')])
g = seaborn.PairGrid(significant_grouped["circular_compactness"].reset_index(),
                 x_vars=significant_grouped["circular_compactness"].columns[1:], y_vars=["signature_type"],
                 height=10, aspect=.25)
g.map(seaborn.stripplot, size=10, orient="h", jitter=False,
      linewidth=1, edgecolor="w")
seaborn.despine(left=True, bottom=True)
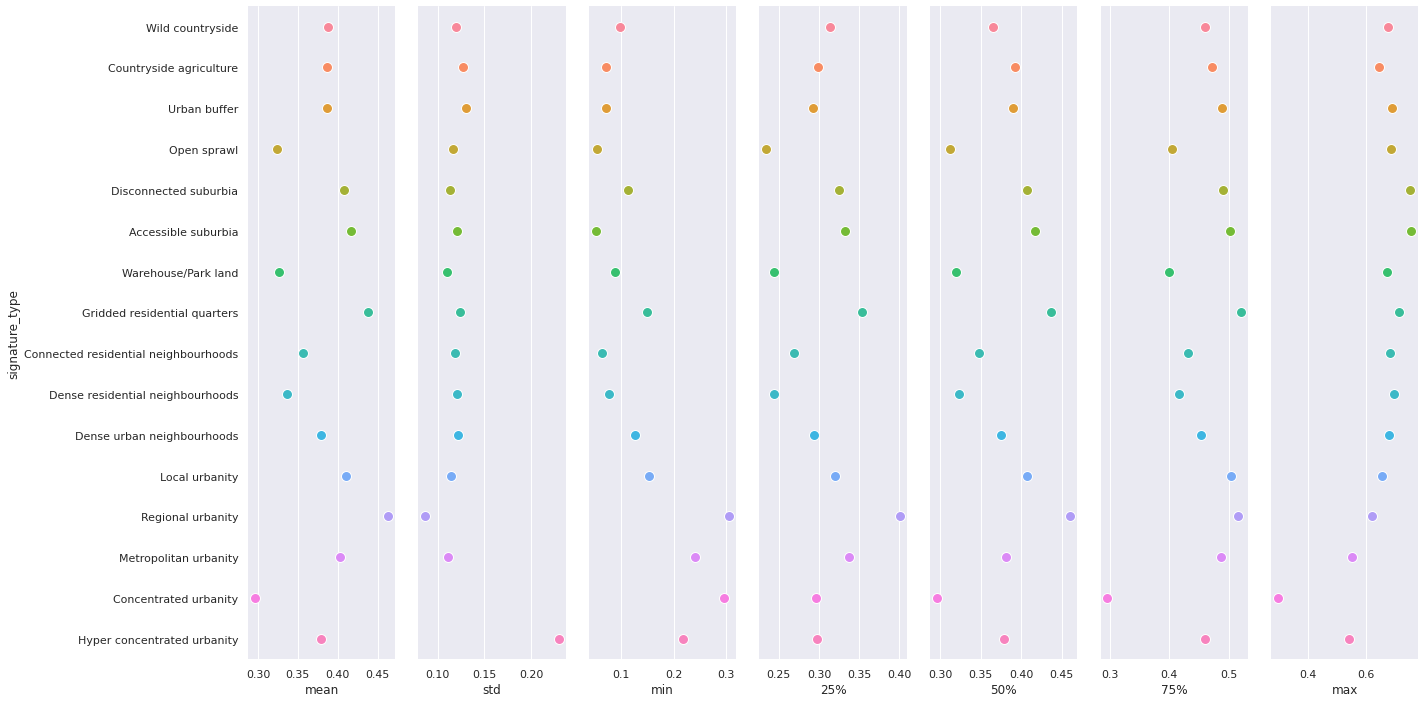
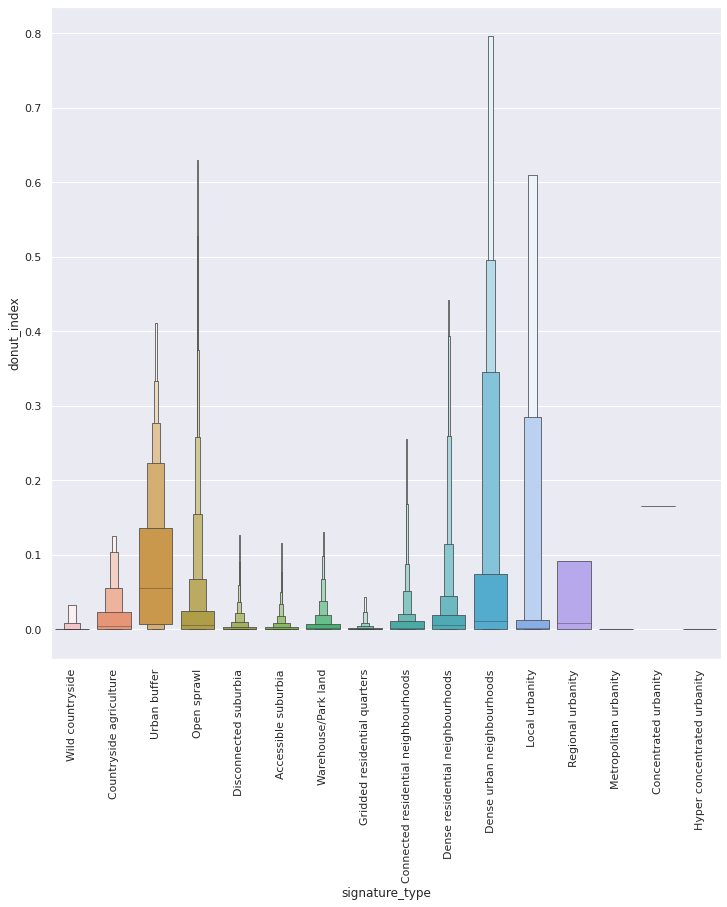
Donut index
fig, ax = plt.subplots(figsize=(12, 12))
seaborn.boxenplot(x="signature_type", y='donut_index', hue='signature_type', dodge=False, data=significant, ax=ax, showfliers=False, linewidth=.75)
ax.legend_.remove()
plt.xticks(rotation=90)
(array([ 0,  1,  2,  3,  4,  5,  6,  7,  8,  9, 10, 11, 12, 13, 14, 15]),
 [Text(0, 0, 'Wild countryside'),
  Text(1, 0, 'Countryside agriculture'),
  Text(2, 0, 'Urban buffer'),
  Text(3, 0, 'Open sprawl'),
  Text(4, 0, 'Disconnected suburbia'),
  Text(5, 0, 'Accessible suburbia'),
  Text(6, 0, 'Warehouse/Park land'),
  Text(7, 0, 'Gridded residential quarters'),
  Text(8, 0, 'Connected residential neighbourhoods'),
  Text(9, 0, 'Dense residential neighbourhoods'),
  Text(10, 0, 'Dense urban neighbourhoods'),
  Text(11, 0, 'Local urbanity'),
  Text(12, 0, 'Regional urbanity'),
  Text(13, 0, 'Metropolitan urbanity'),
  Text(14, 0, 'Concentrated urbanity'),
  Text(15, 0, 'Hyper concentrated urbanity')])
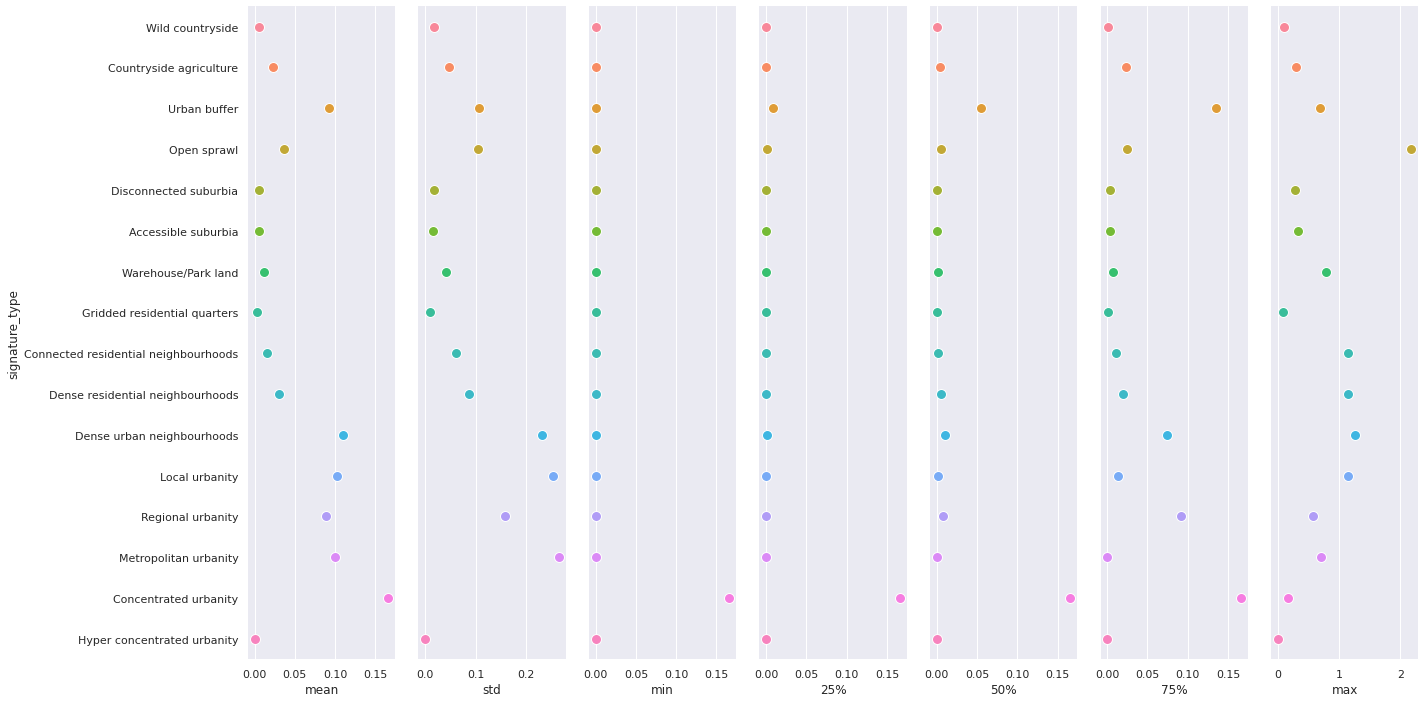
g = seaborn.PairGrid(significant_grouped["donut_index"].reset_index(),
                 x_vars=significant_grouped["donut_index"].columns[1:], y_vars=["signature_type"],
                 height=10, aspect=.25)
g.map(seaborn.stripplot, size=10, orient="h", jitter=False,
      linewidth=1, edgecolor="w")
seaborn.despine(left=True, bottom=True)
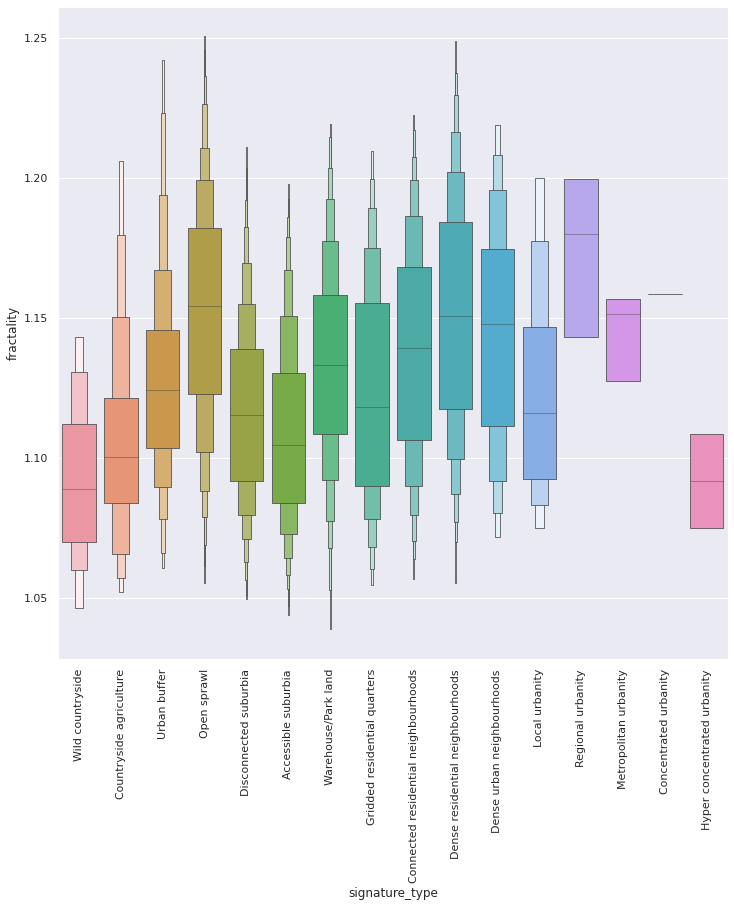
Fractality
fig, ax = plt.subplots(figsize=(12, 12))
seaborn.boxenplot(x="signature_type", y='fractality', hue='signature_type', dodge=False, data=significant, ax=ax, showfliers=False, linewidth=.75)
ax.legend_.remove()
plt.xticks(rotation=90)
(array([ 0,  1,  2,  3,  4,  5,  6,  7,  8,  9, 10, 11, 12, 13, 14, 15]),
 [Text(0, 0, 'Wild countryside'),
  Text(1, 0, 'Countryside agriculture'),
  Text(2, 0, 'Urban buffer'),
  Text(3, 0, 'Open sprawl'),
  Text(4, 0, 'Disconnected suburbia'),
  Text(5, 0, 'Accessible suburbia'),
  Text(6, 0, 'Warehouse/Park land'),
  Text(7, 0, 'Gridded residential quarters'),
  Text(8, 0, 'Connected residential neighbourhoods'),
  Text(9, 0, 'Dense residential neighbourhoods'),
  Text(10, 0, 'Dense urban neighbourhoods'),
  Text(11, 0, 'Local urbanity'),
  Text(12, 0, 'Regional urbanity'),
  Text(13, 0, 'Metropolitan urbanity'),
  Text(14, 0, 'Concentrated urbanity'),
  Text(15, 0, 'Hyper concentrated urbanity')])
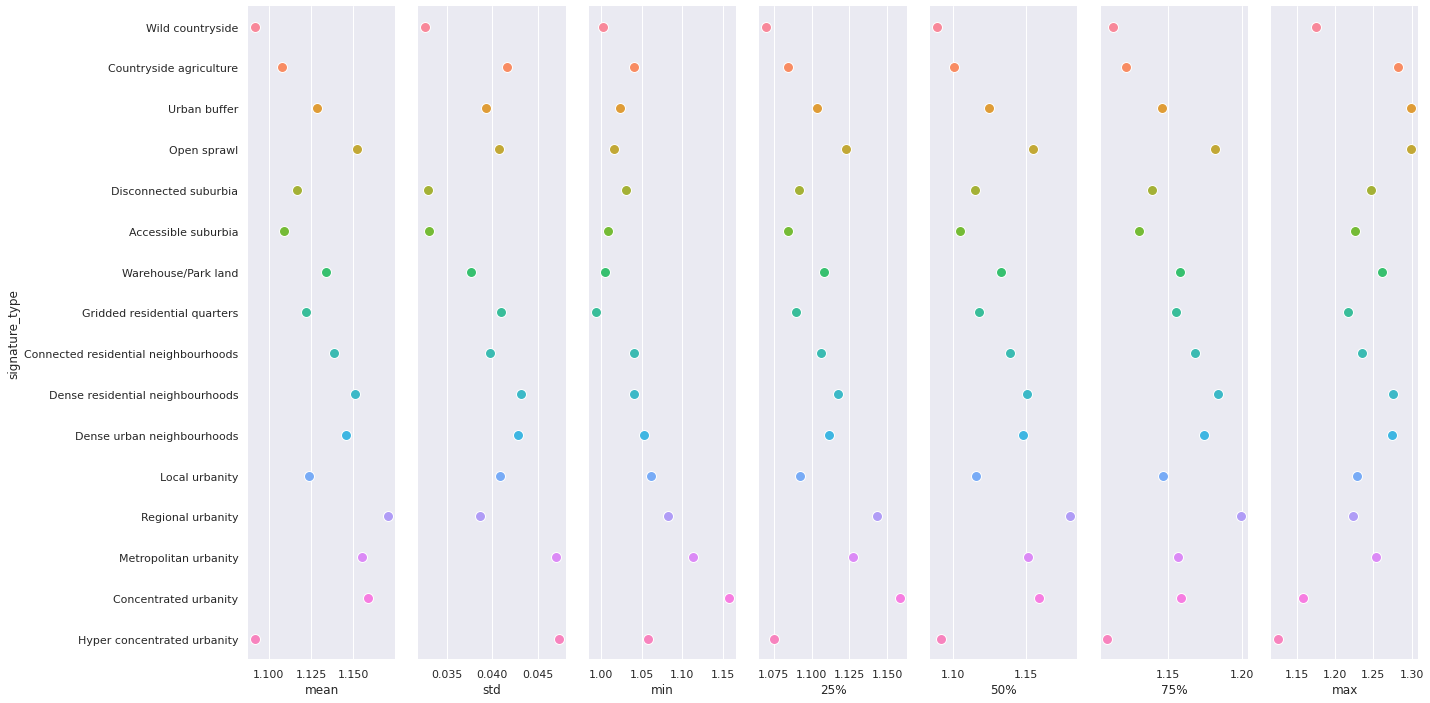
g = seaborn.PairGrid(significant_grouped["fractality"].reset_index(),
                 x_vars=significant_grouped["fractality"].columns[1:], y_vars=["signature_type"],
                 height=10, aspect=.25)
g.map(seaborn.stripplot, size=10, orient="h", jitter=False,
      linewidth=1, edgecolor="w")
seaborn.despine(left=True, bottom=True)
Convexity
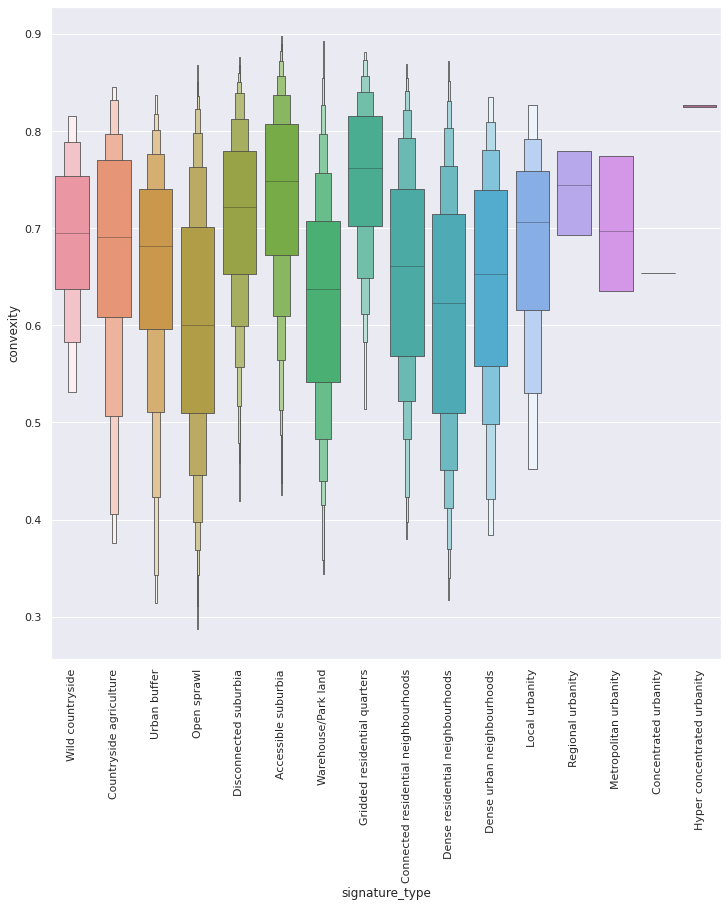
fig, ax = plt.subplots(figsize=(12, 12))
seaborn.boxenplot(x="signature_type", y='convexity', hue='signature_type', dodge=False, data=significant, ax=ax, showfliers=False, linewidth=.75)
ax.legend_.remove()
plt.xticks(rotation=90)
(array([ 0,  1,  2,  3,  4,  5,  6,  7,  8,  9, 10, 11, 12, 13, 14, 15]),
 [Text(0, 0, 'Wild countryside'),
  Text(1, 0, 'Countryside agriculture'),
  Text(2, 0, 'Urban buffer'),
  Text(3, 0, 'Open sprawl'),
  Text(4, 0, 'Disconnected suburbia'),
  Text(5, 0, 'Accessible suburbia'),
  Text(6, 0, 'Warehouse/Park land'),
  Text(7, 0, 'Gridded residential quarters'),
  Text(8, 0, 'Connected residential neighbourhoods'),
  Text(9, 0, 'Dense residential neighbourhoods'),
  Text(10, 0, 'Dense urban neighbourhoods'),
  Text(11, 0, 'Local urbanity'),
  Text(12, 0, 'Regional urbanity'),
  Text(13, 0, 'Metropolitan urbanity'),
  Text(14, 0, 'Concentrated urbanity'),
  Text(15, 0, 'Hyper concentrated urbanity')])
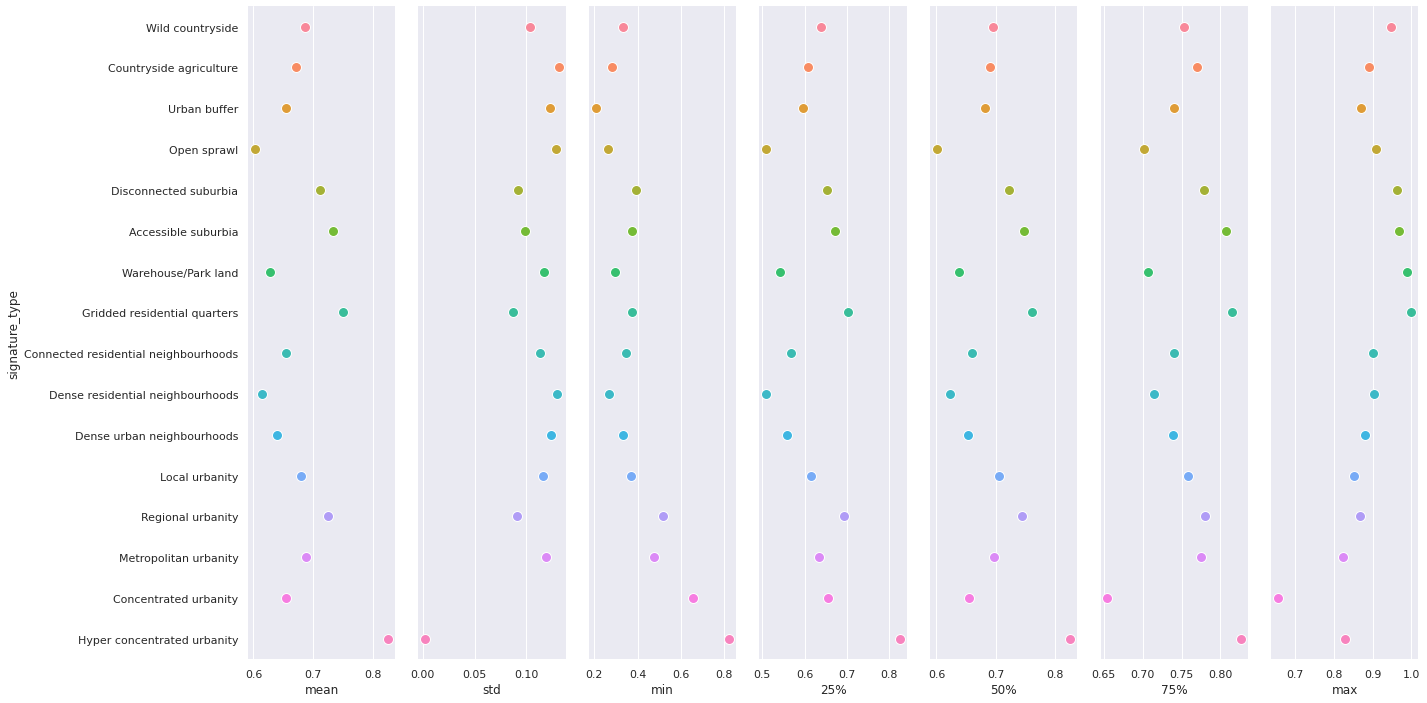
g = seaborn.PairGrid(significant_grouped["convexity"].reset_index(),
                 x_vars=significant_grouped["convexity"].columns[1:], y_vars=["signature_type"],
                 height=10, aspect=.25)
g.map(seaborn.stripplot, size=10, orient="h", jitter=False,
      linewidth=1, edgecolor="w")
seaborn.despine(left=True, bottom=True)
Notes
Area
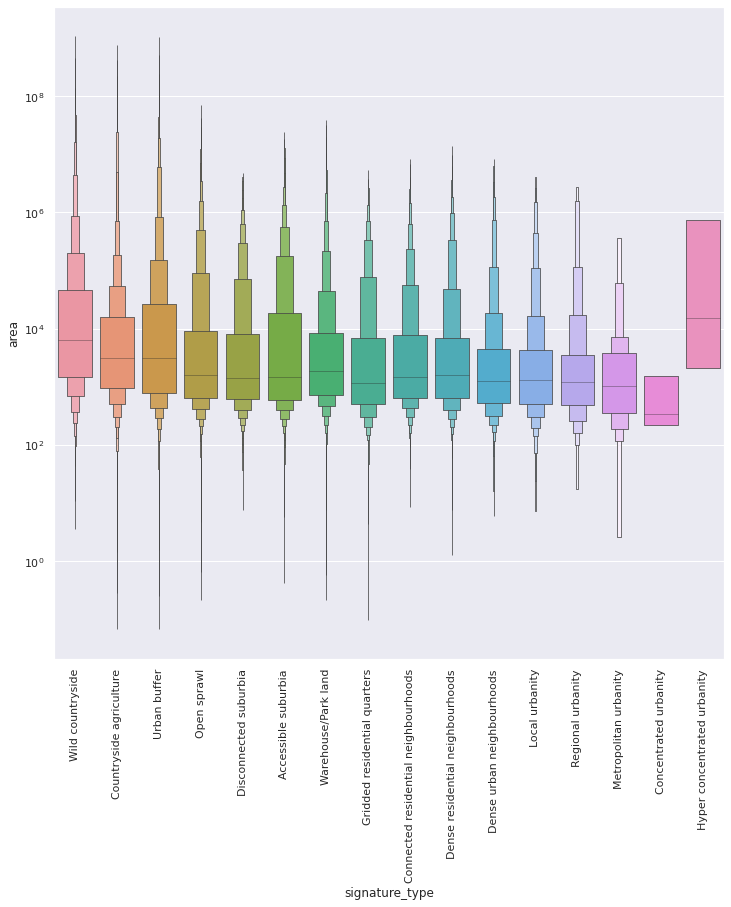
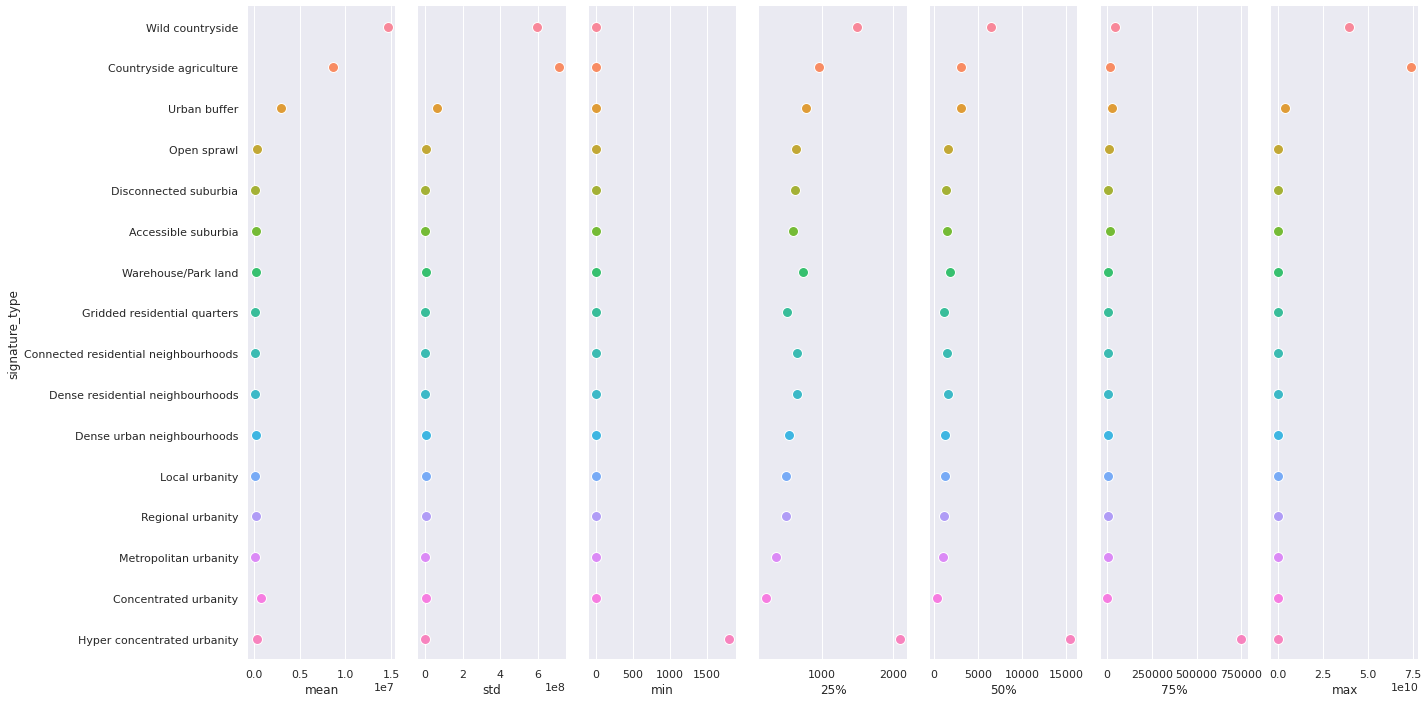
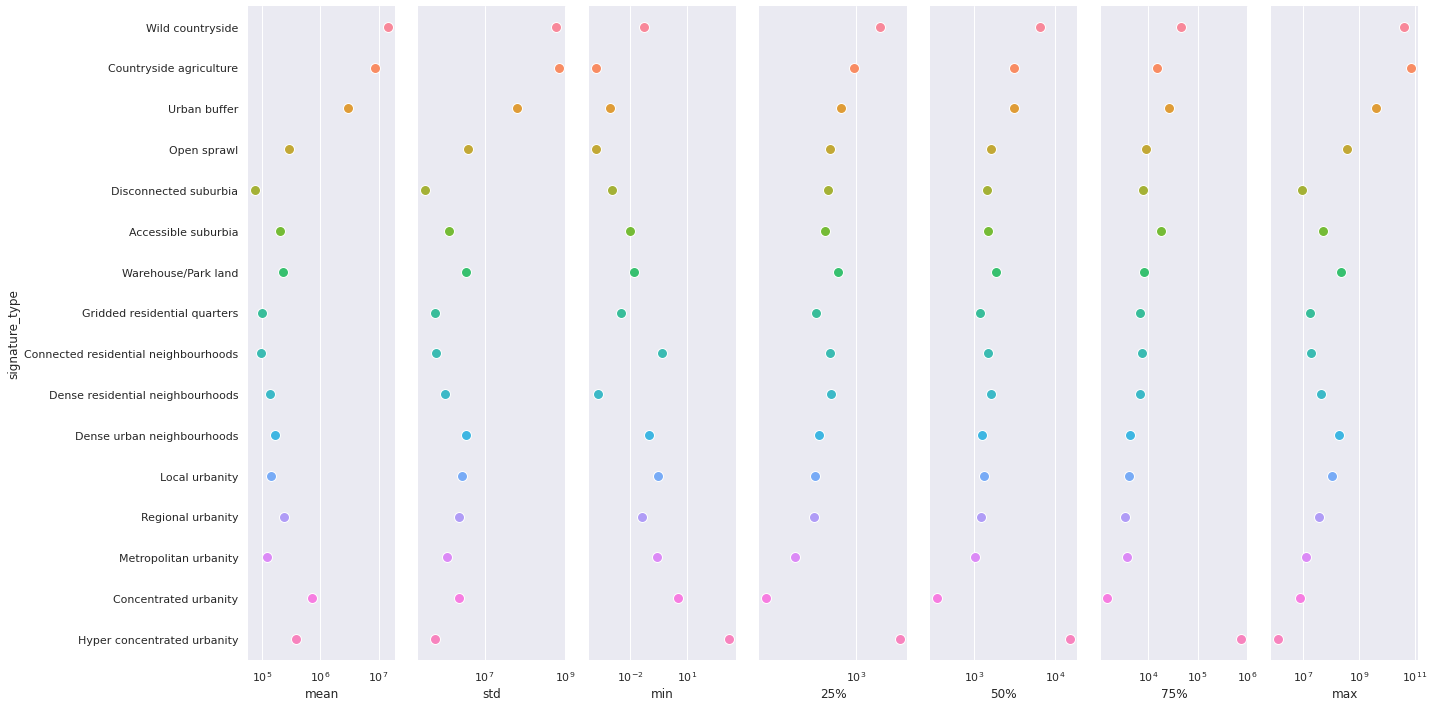
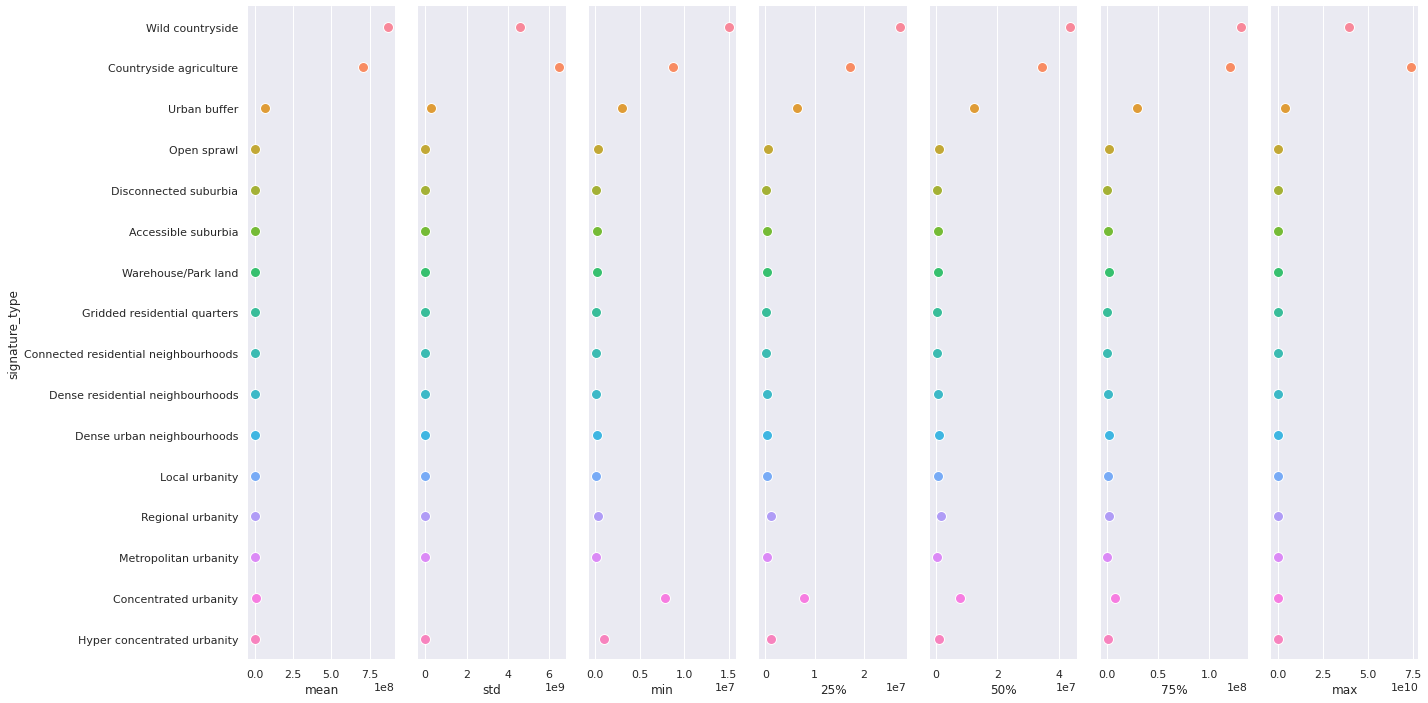
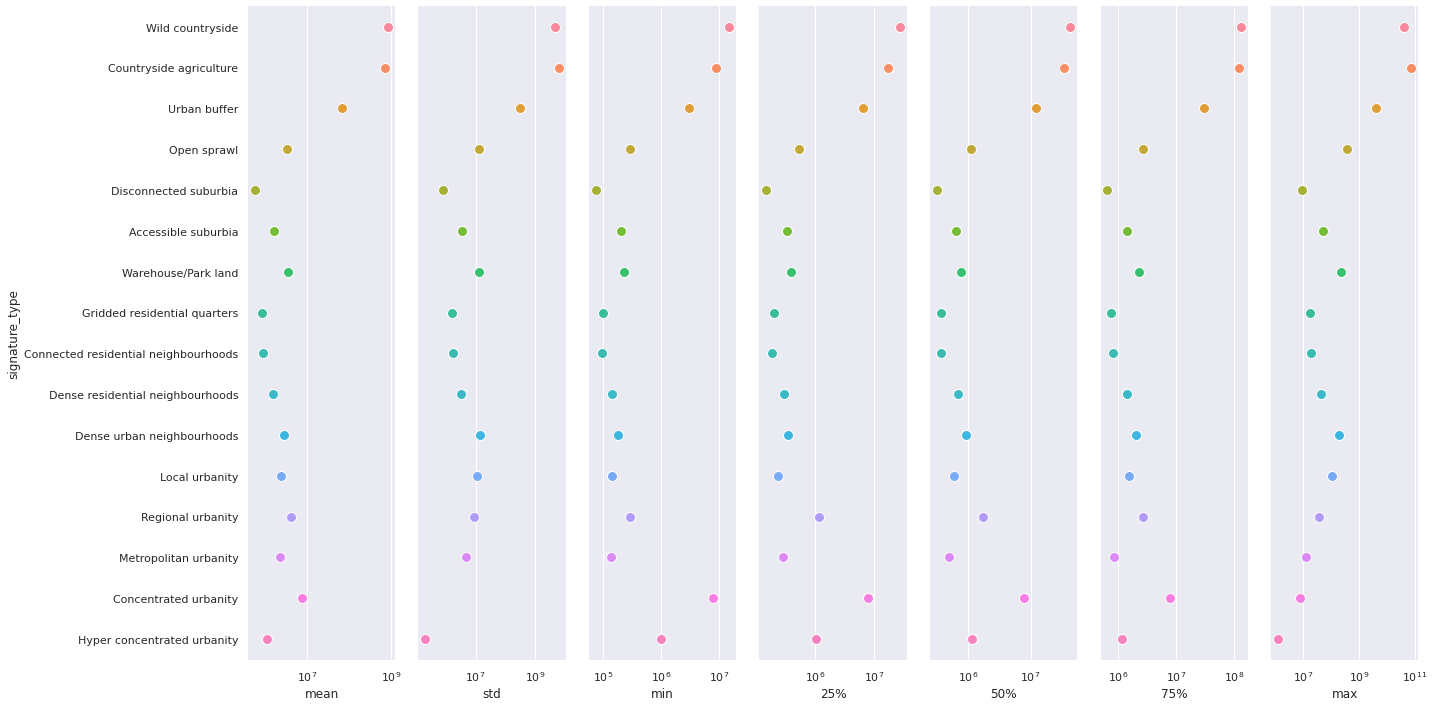
Wild countryside, Countryside agriculture and Urban buffer much larger than the rest. The difference between more urban signatures is small, with an exception of Warehouse/Park land that tends to be a bit larger and Disconnected suburbia that tends to be smaller.
Perimeter
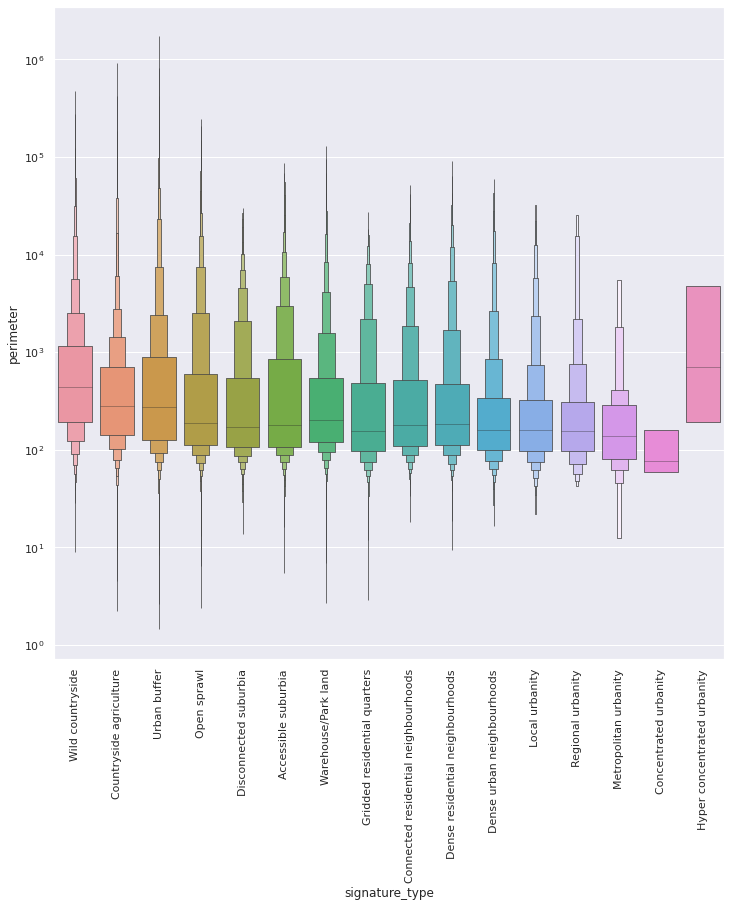
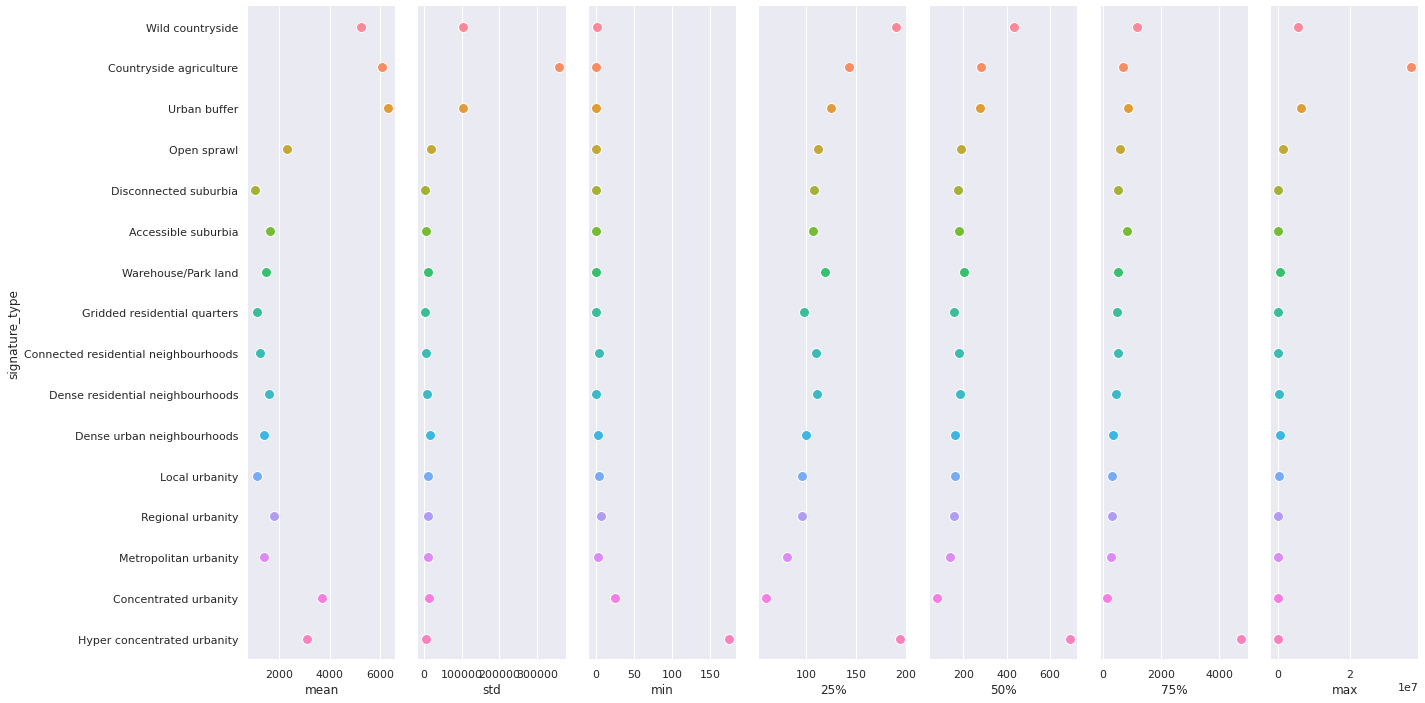
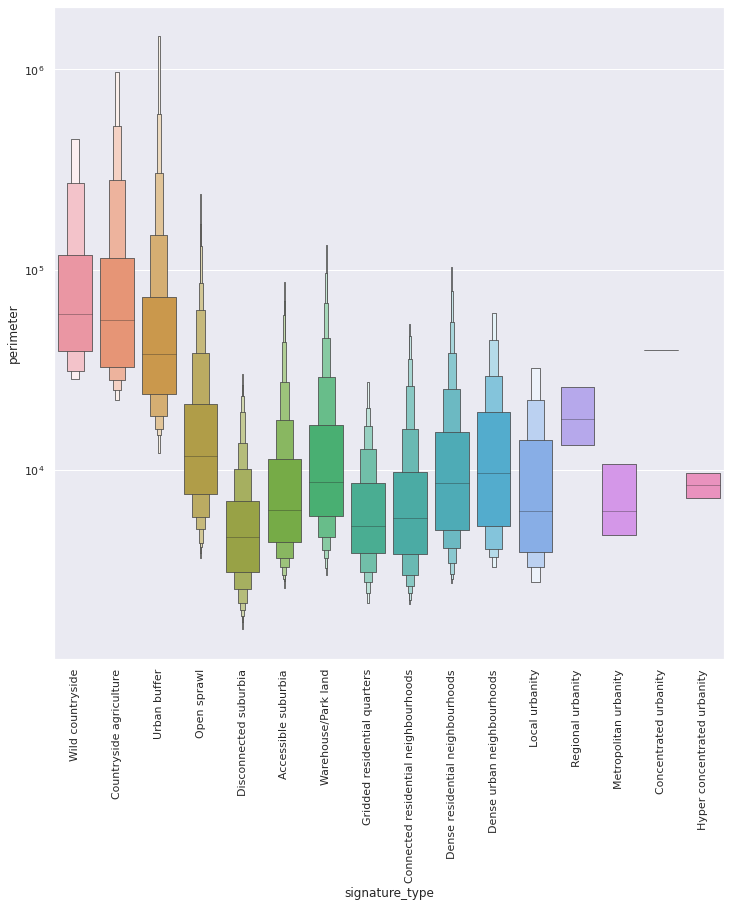
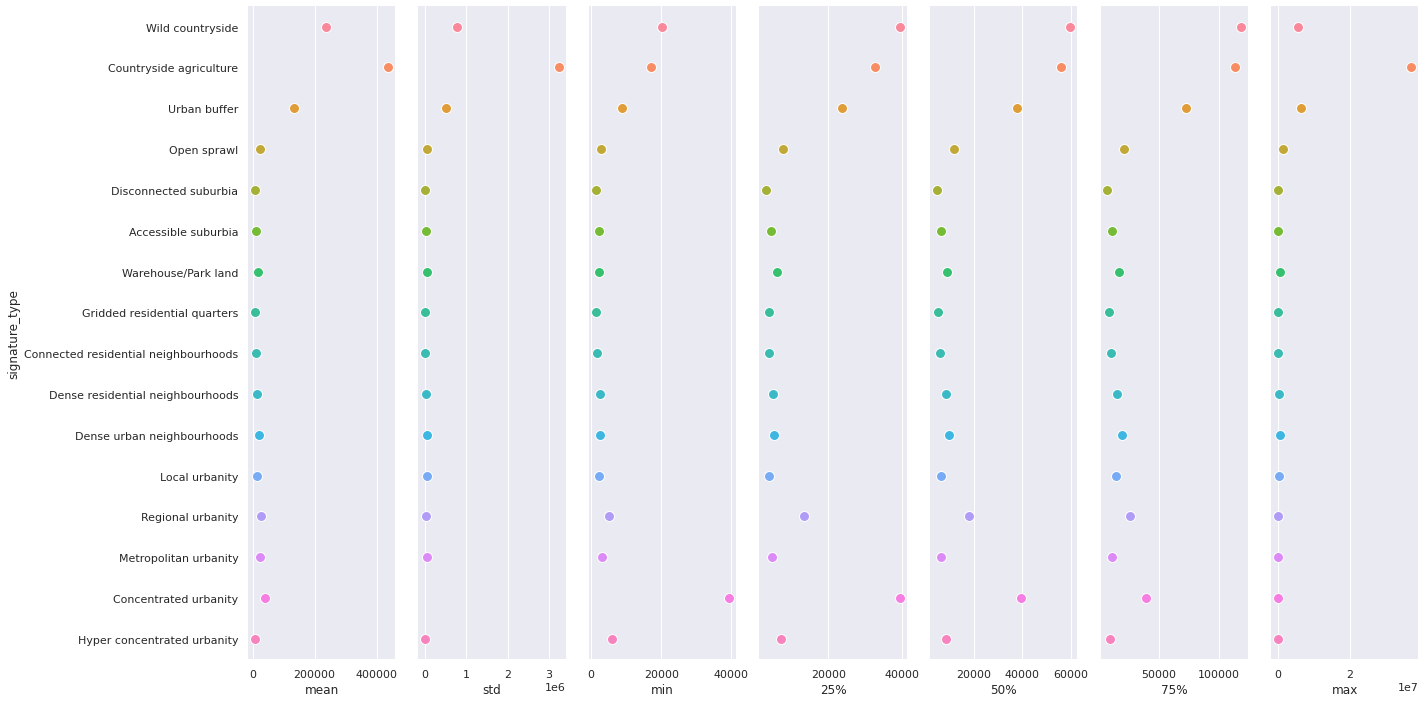
Very similar as area, we could almost say the same.
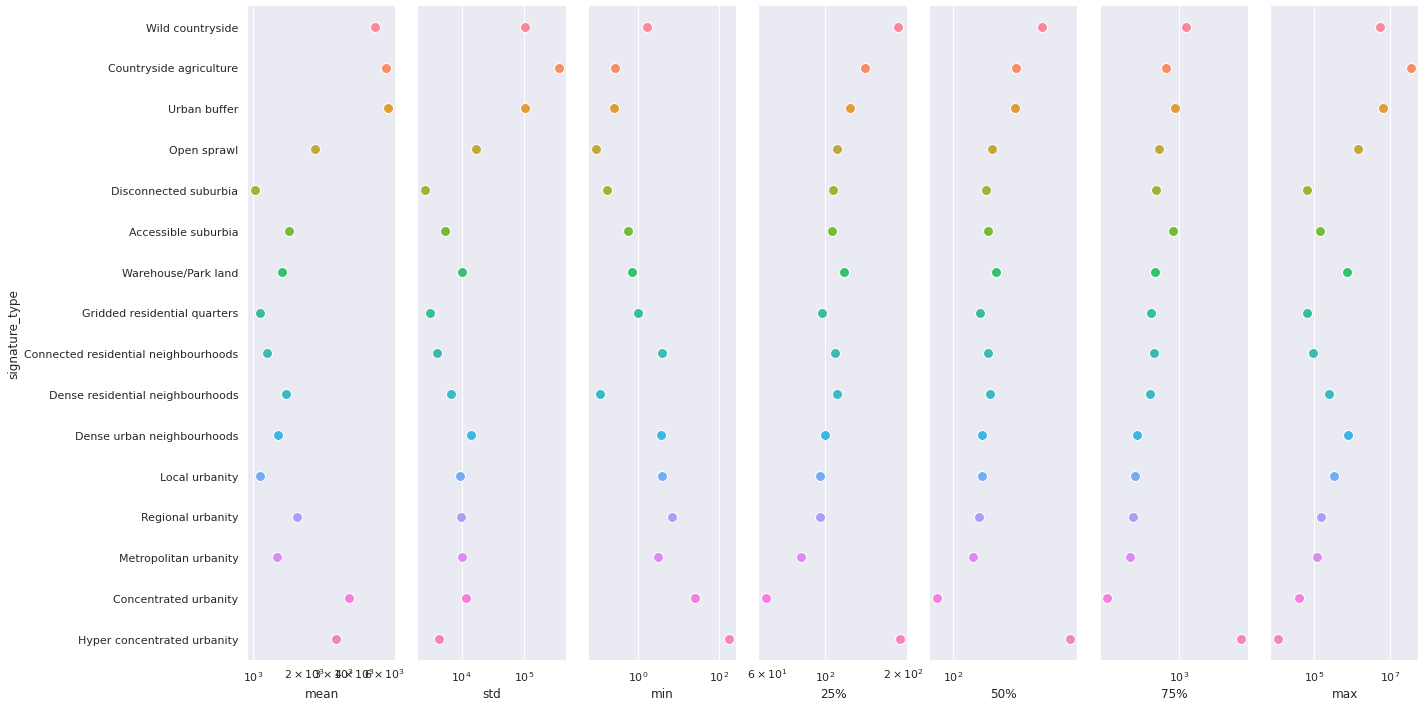
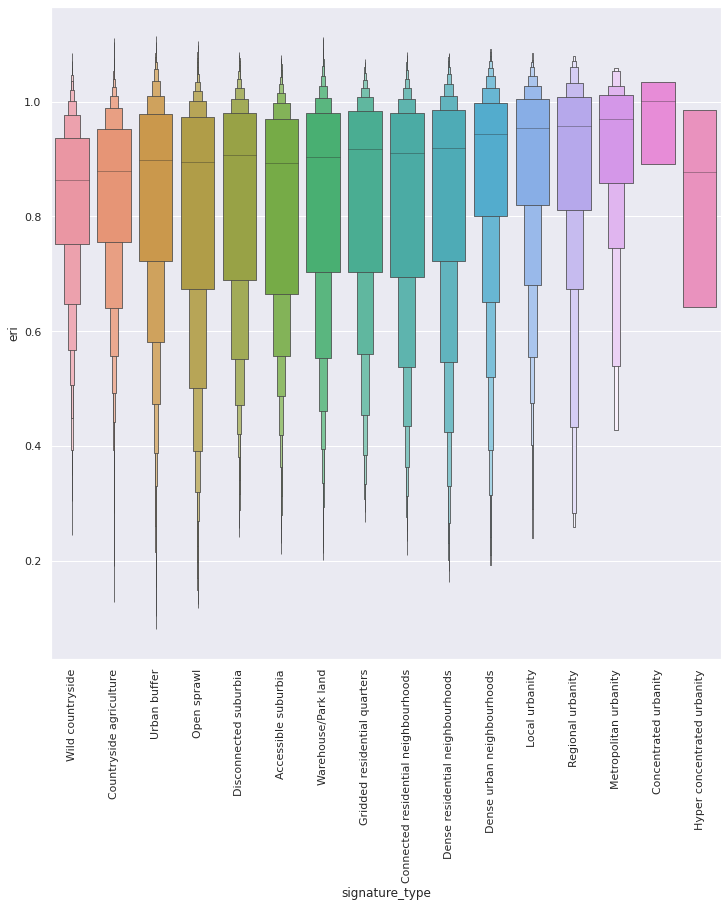
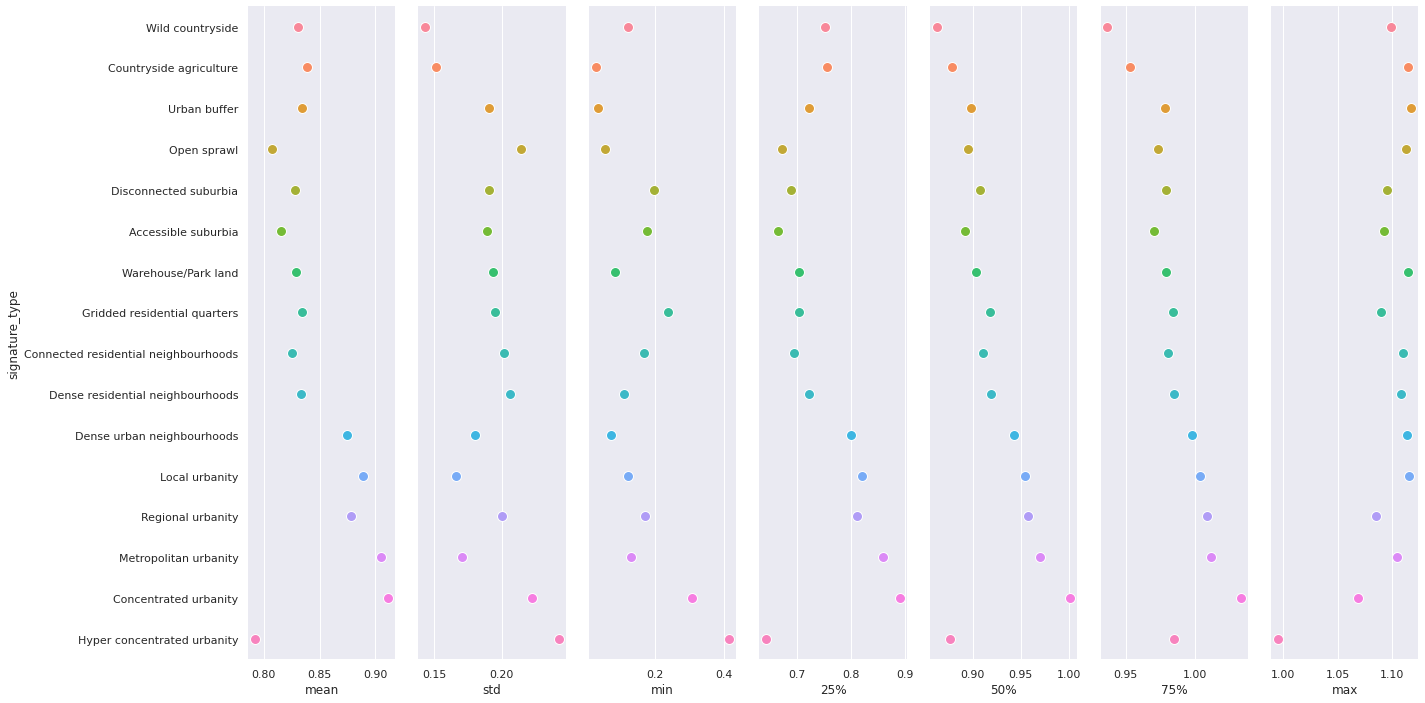
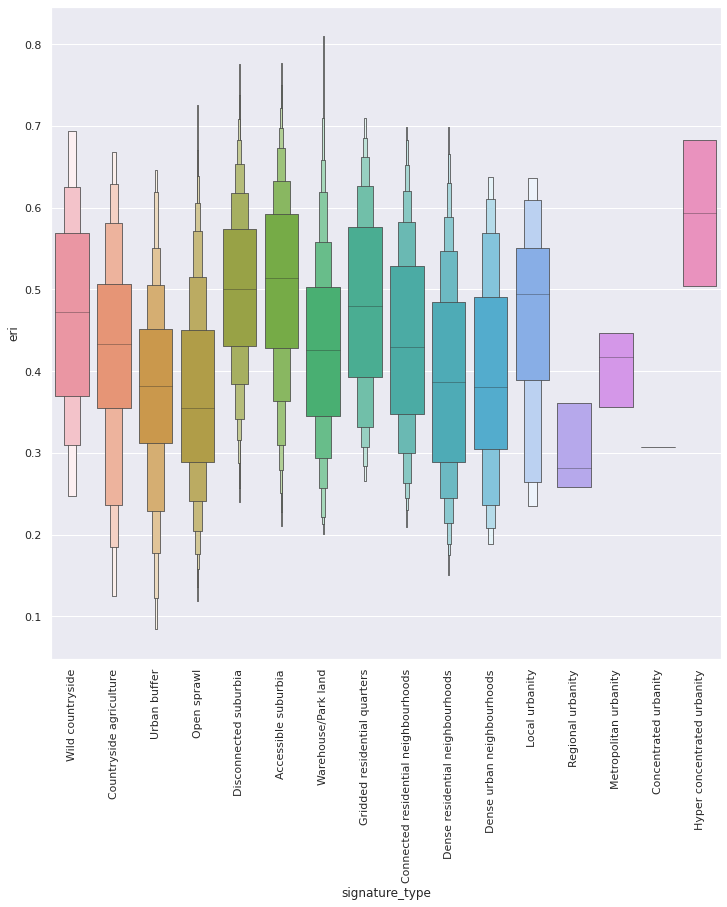
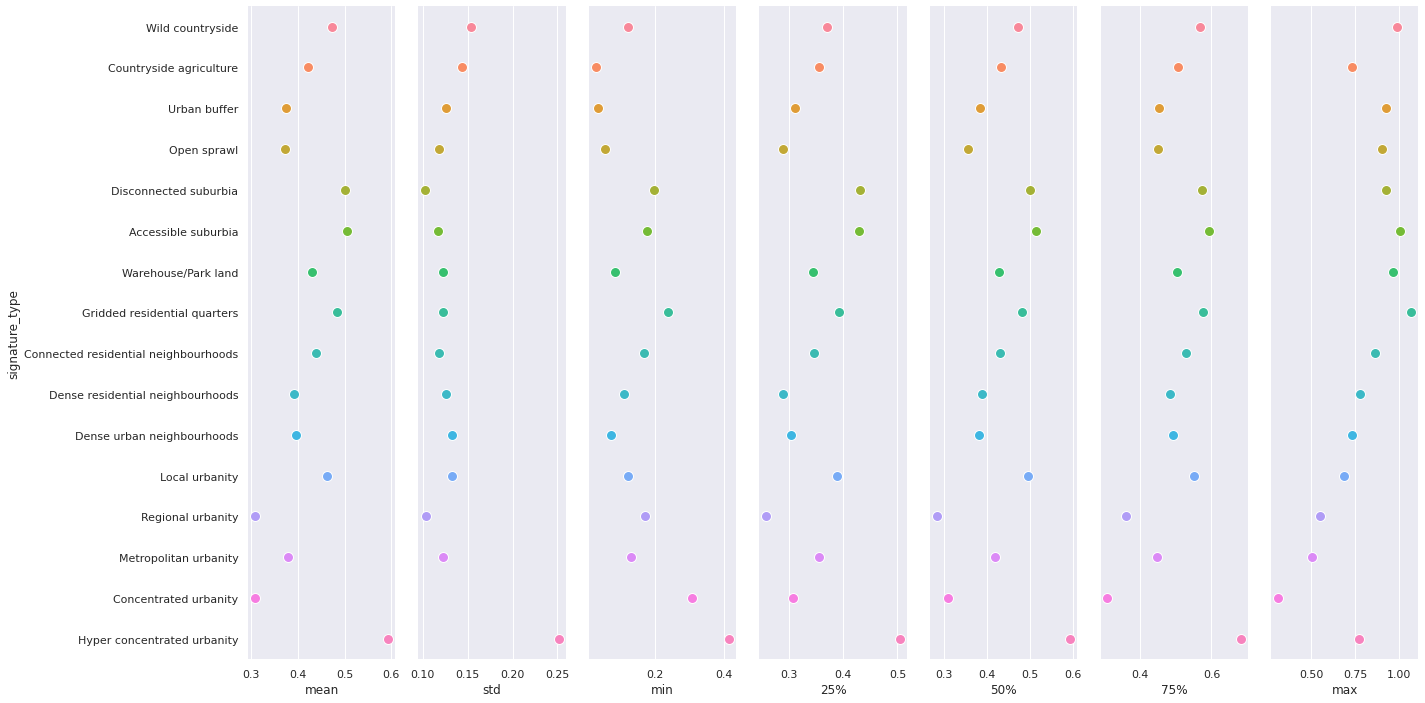
Equivalent rectangular index
(higher the value is, less complex the shape is)
There’s an intereseting tendency shown - more urban signatures tend to be less complex in shape than rural ones and there is almost a gradient of increasing complexity as we lose urbanity. In other words, more urban singatures have much simpler shapes.
However, this clear tendency is lost when we take into account only 50% largest polygons.
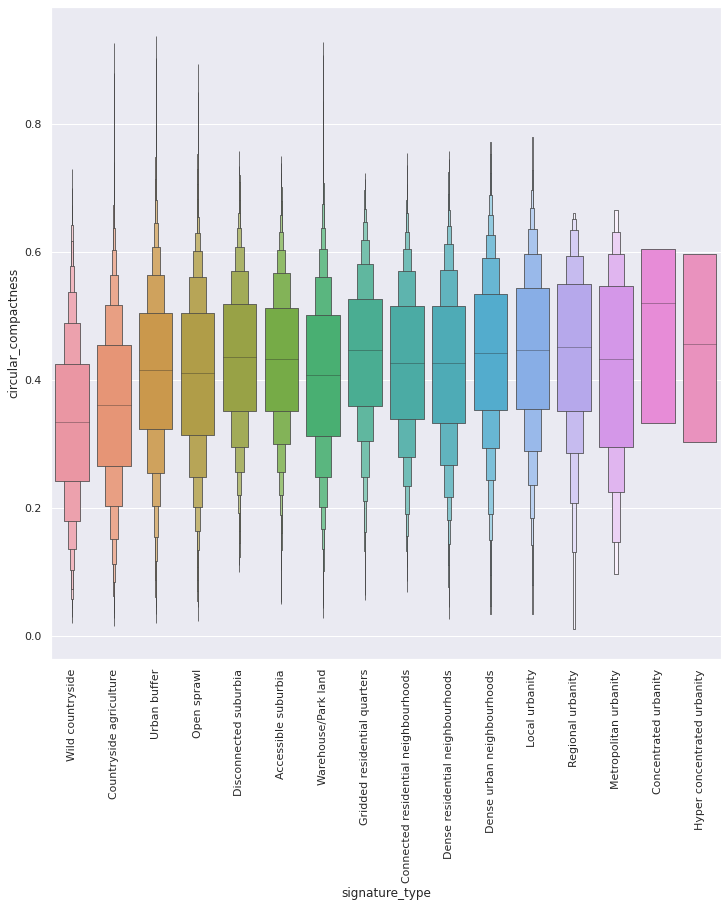
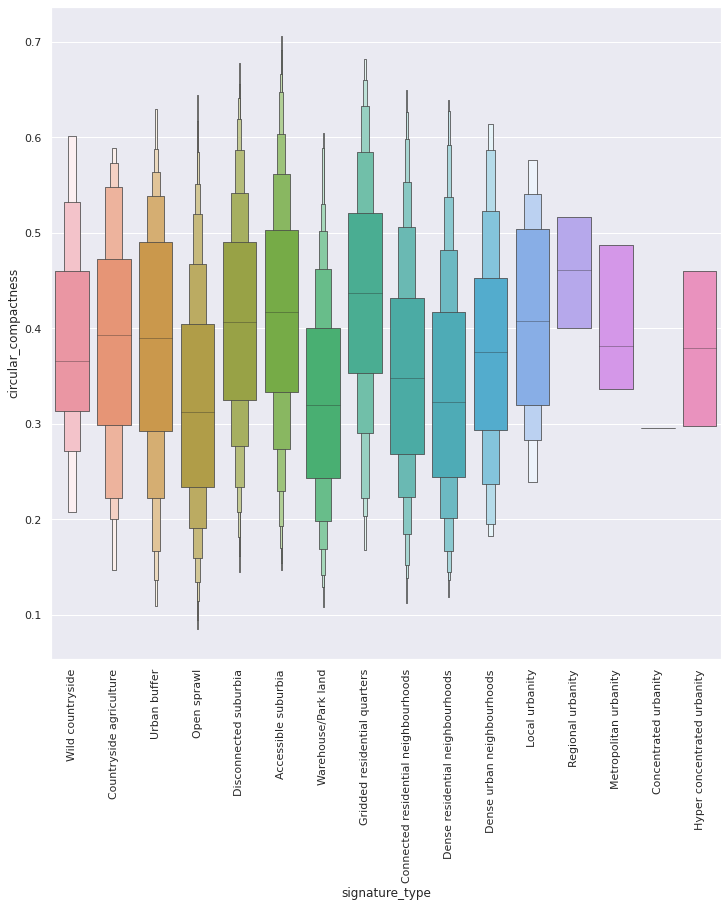
Circular compactness
(higher value means more compact, circle-like shape)
Nothing super interesting comes up. Countryside tends to have less compact shapes but the rest doesn’t tell much.
Donut index
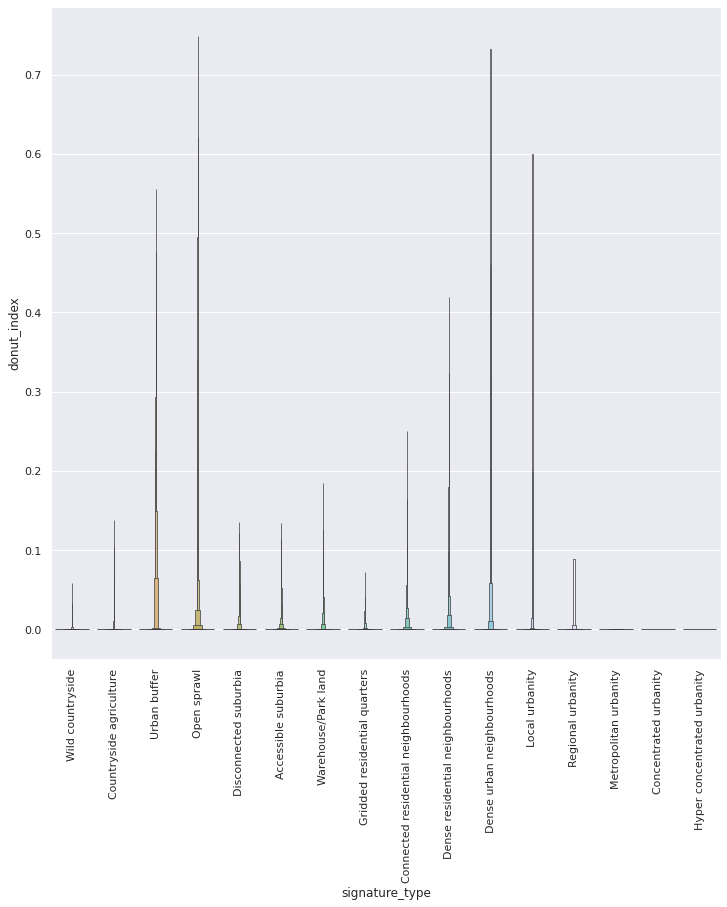
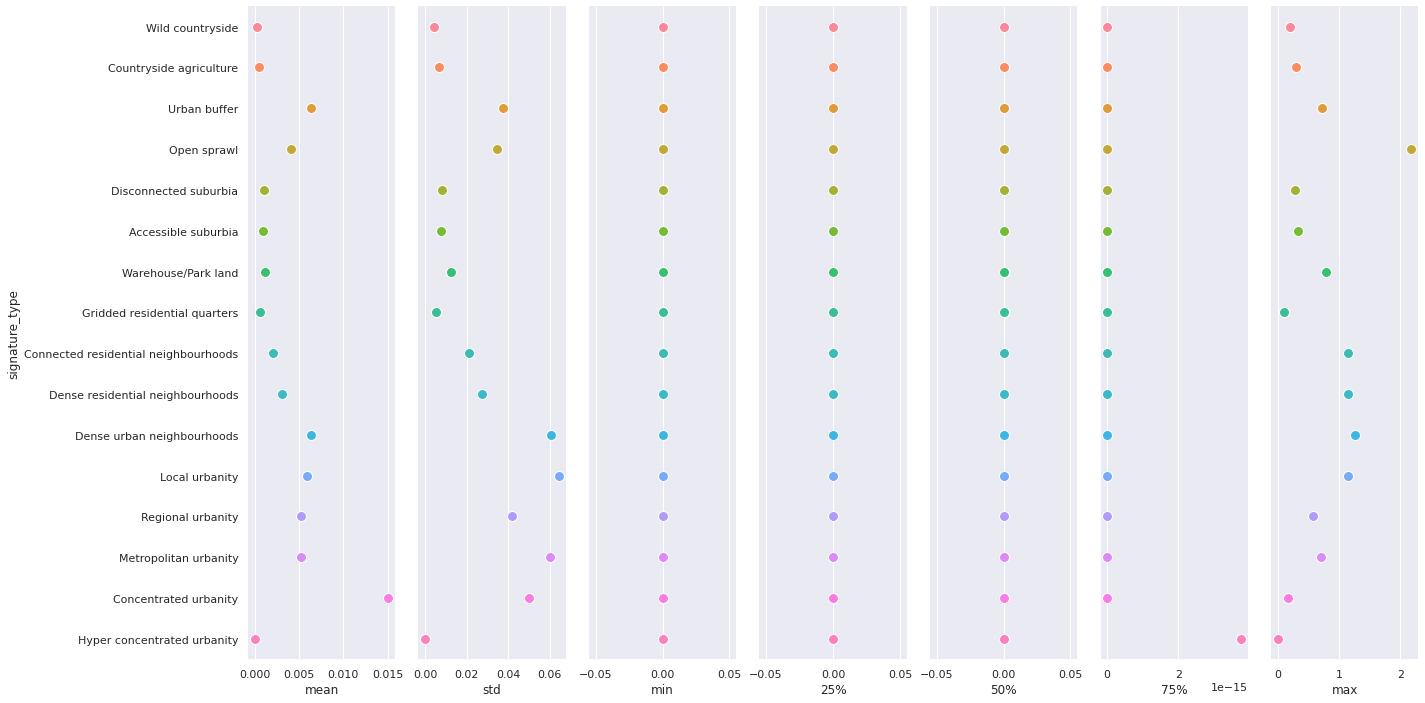
(higher values means more holes)
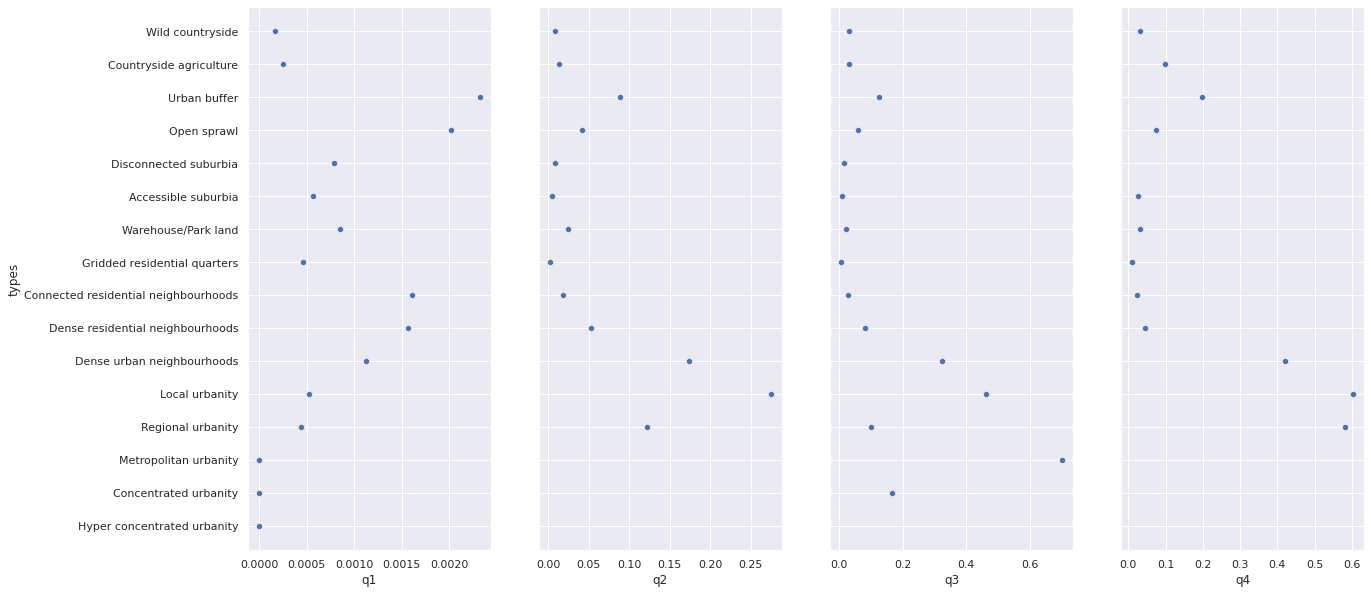
This is interesting. We have two groups of signatures showing donut-like tendency.
Countryside right next to the city - urban buffer and open sprawl have a tendency to encircle more urban development
Dense central areas - dense urban neighbourhoods and the urbanity singatures tend to form concentric rings, therefore having a donut shape.
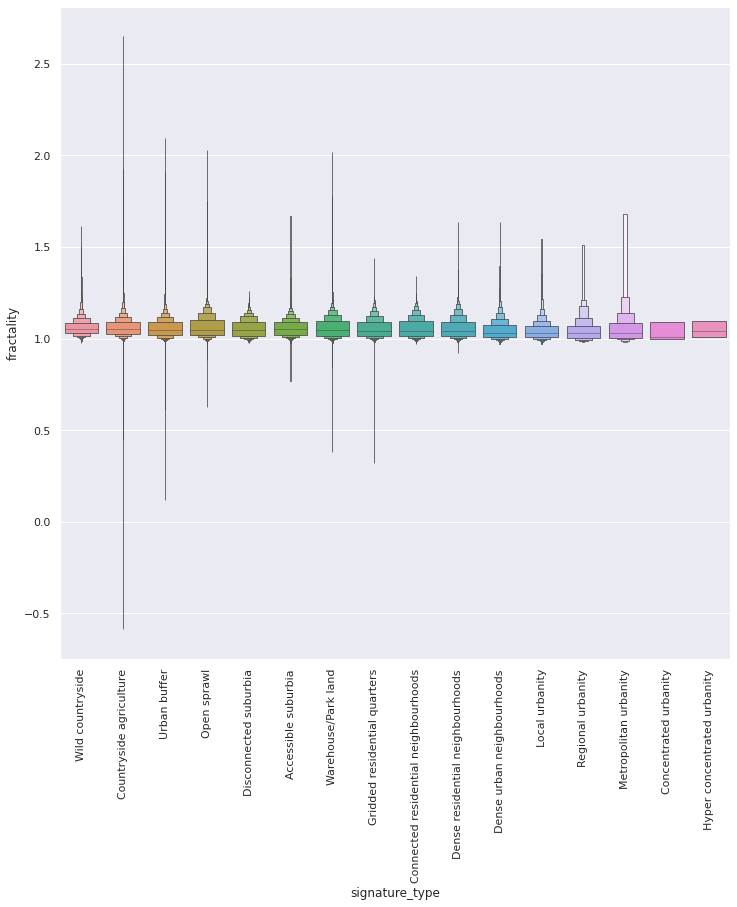
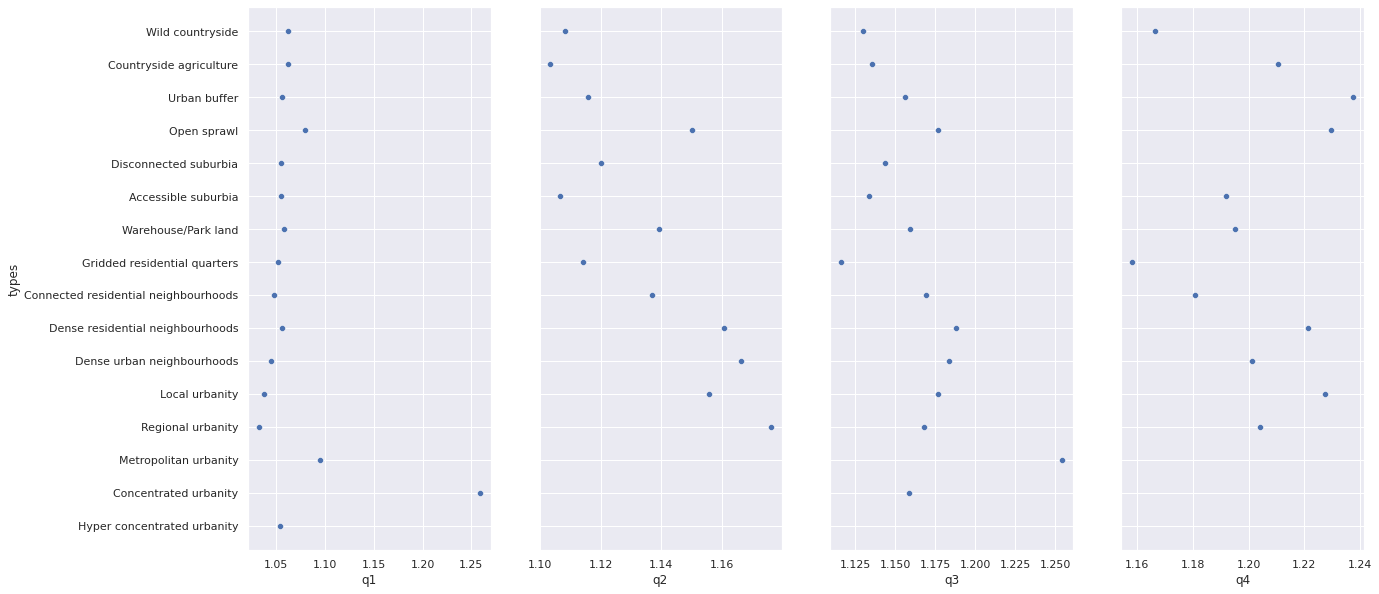
Fractality
(higher means more fractal-like)
There is some variation, especially looking only at top 50% but I am not sure if there is any specific tendency apart from a relative randomness.
By area and cell count
signatures
| signature_type | area | perimeter | eri | circular_compactness | donut_index | fractality | convexity | |
|---|---|---|---|---|---|---|---|---|
| 0 | Countryside agriculture | 1.826984e+07 | 29577.575163 | 0.601828 | 0.439852 | 7.105984e-05 | 1.065559 | 0.788857 |
| 1 | Countryside agriculture | 1.235908e+04 | 555.207264 | 0.892662 | 0.254347 | 0.000000e+00 | 1.047118 | 0.983245 |
| 2 | Countryside agriculture | 7.234542e+05 | 5746.792461 | 0.602136 | 0.339522 | 0.000000e+00 | 1.077707 | 0.629428 |
| 3 | Countryside agriculture | 1.229467e+06 | 6161.670240 | 0.731125 | 0.306803 | 0.000000e+00 | 1.046892 | 0.799648 |
| 4 | Countryside agriculture | 7.604014e+06 | 22500.262066 | 0.539593 | 0.252670 | 2.808737e-04 | 1.089988 | 0.641429 |
| ... | ... | ... | ... | ... | ... | ... | ... | ... |
| 96687 | Hyper concentrated urbanity | 1.797907e+03 | 187.424114 | 0.981508 | 0.369170 | 0.000000e+00 | 1.026657 | 0.996822 |
| 96688 | Hyper concentrated urbanity | 1.271663e+06 | 10882.240090 | 0.415598 | 0.541253 | 1.464732e-14 | 1.125311 | 0.827377 |
| 96689 | Hyper concentrated urbanity | 1.872188e+03 | 175.432872 | 0.986566 | 0.621376 | 0.000000e+00 | 1.003591 | 0.980982 |
| 96690 | Hyper concentrated urbanity | 2.767724e+03 | 213.469395 | 0.995107 | 0.614557 | 0.000000e+00 | 1.003611 | 0.965406 |
| 96691 | Hyper concentrated urbanity | 9.875395e+05 | 5945.760474 | 0.771656 | 0.216829 | 0.000000e+00 | 1.058343 | 0.824101 |
96689 rows × 8 columns
joined = dask.dataframe.read_parquet("../../urbangrammar_samba/spatial_signatures/signatures/hindex_to_type")
counts = joined.groupby('id').count()
counts = counts.compute()
counts
| hindex | type | |
|---|---|---|
| id | ||
| 459 | 2461180 | 2461180 |
| 2797 | 2 | 2 |
| 2801 | 1 | 1 |
| 2817 | 2 | 2 |
| 2818 | 1 | 1 |
| ... | ... | ... |
| 95069 | 313 | 313 |
| 95071 | 1 | 1 |
| 95072 | 1 | 1 |
| 95075 | 2 | 2 |
| 95077 | 1 | 1 |
96704 rows × 2 columns
signatures["cell_count"] = counts.type
<ipython-input-12-a85cca808231>:1: SettingWithCopyWarning:
A value is trying to be set on a copy of a slice from a DataFrame.
Try using .loc[row_indexer,col_indexer] = value instead

See the caveats in the documentation: https://pandas.pydata.org/pandas-docs/stable/user_guide/indexing.html#returning-a-view-versus-a-copy
  signatures["cell_count"] = counts.type
for cat in signatures.signature_type.cat.categories:
    mask = signatures.signature_type == cat
    desc = signatures[mask].cell_count.describe()
    signatures.loc[mask, "count_quartile"] = pandas.cut(signatures[mask].cell_count, bins=[0, desc["25%"]+.1, desc["50%"]+.2, desc["75%"]+.3, desc['max']], labels=["q1", "q2", "q3", "q4"])
/opt/conda/lib/python3.8/site-packages/pandas/core/indexing.py:1676: SettingWithCopyWarning:
A value is trying to be set on a copy of a slice from a DataFrame.
Try using .loc[row_indexer,col_indexer] = value instead

See the caveats in the documentation: https://pandas.pydata.org/pandas-docs/stable/user_guide/indexing.html#returning-a-view-versus-a-copy
  self._setitem_single_column(ilocs[0], value, pi)
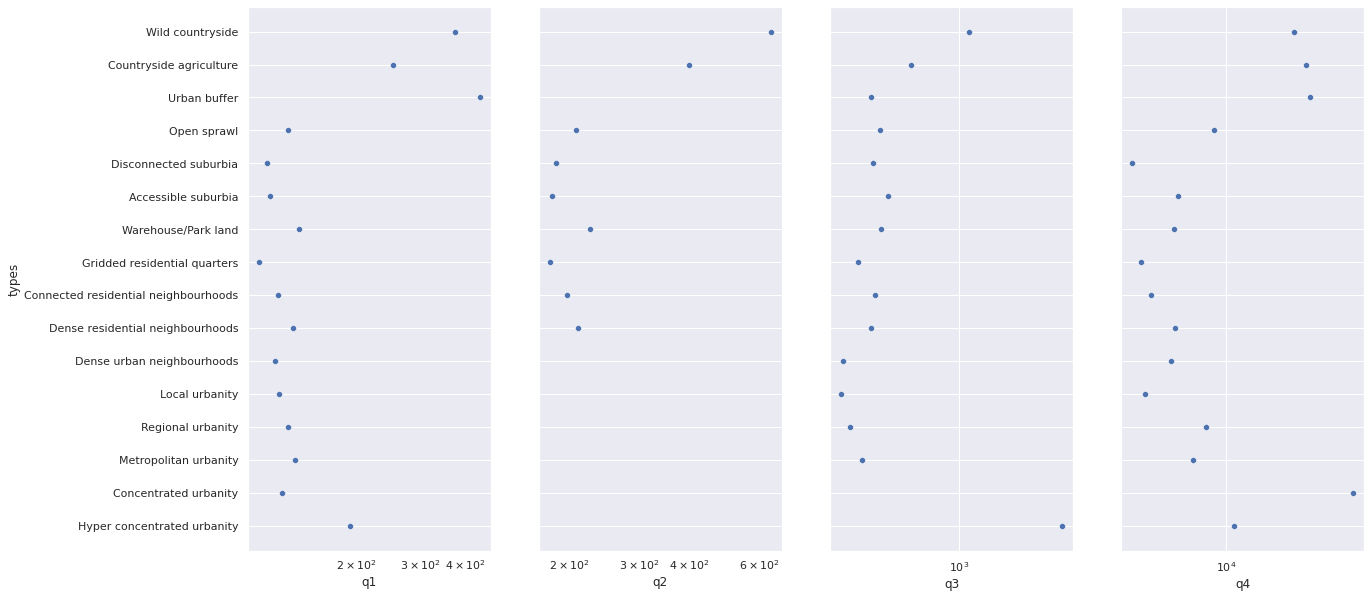
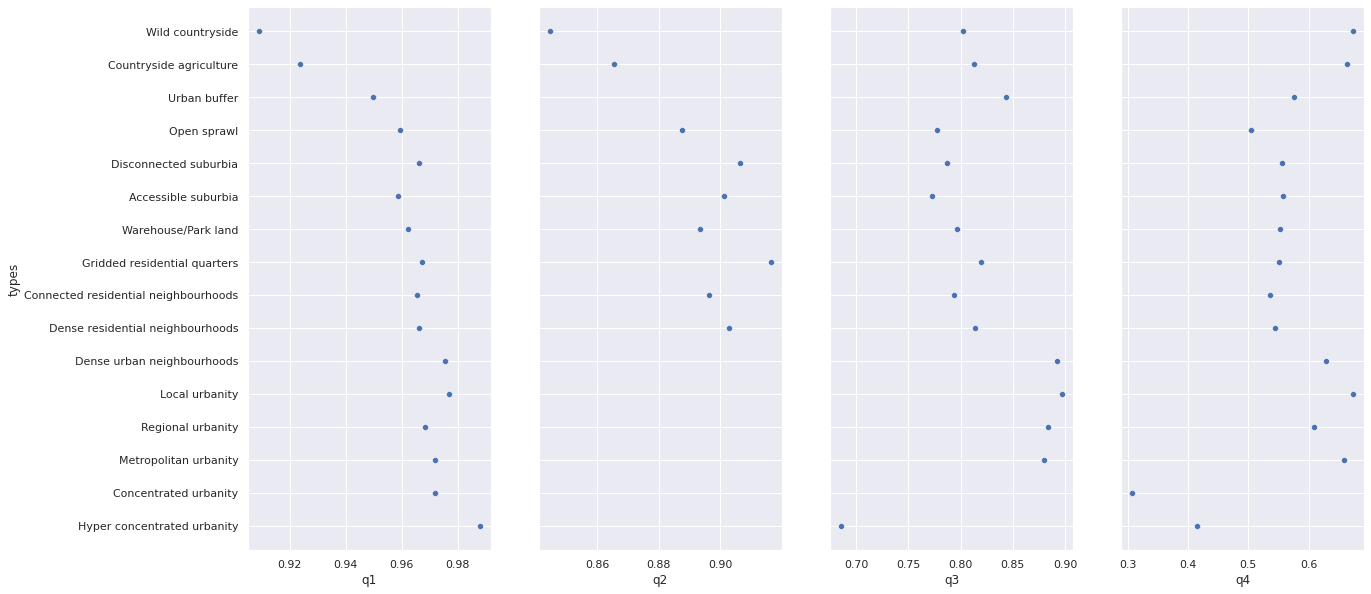
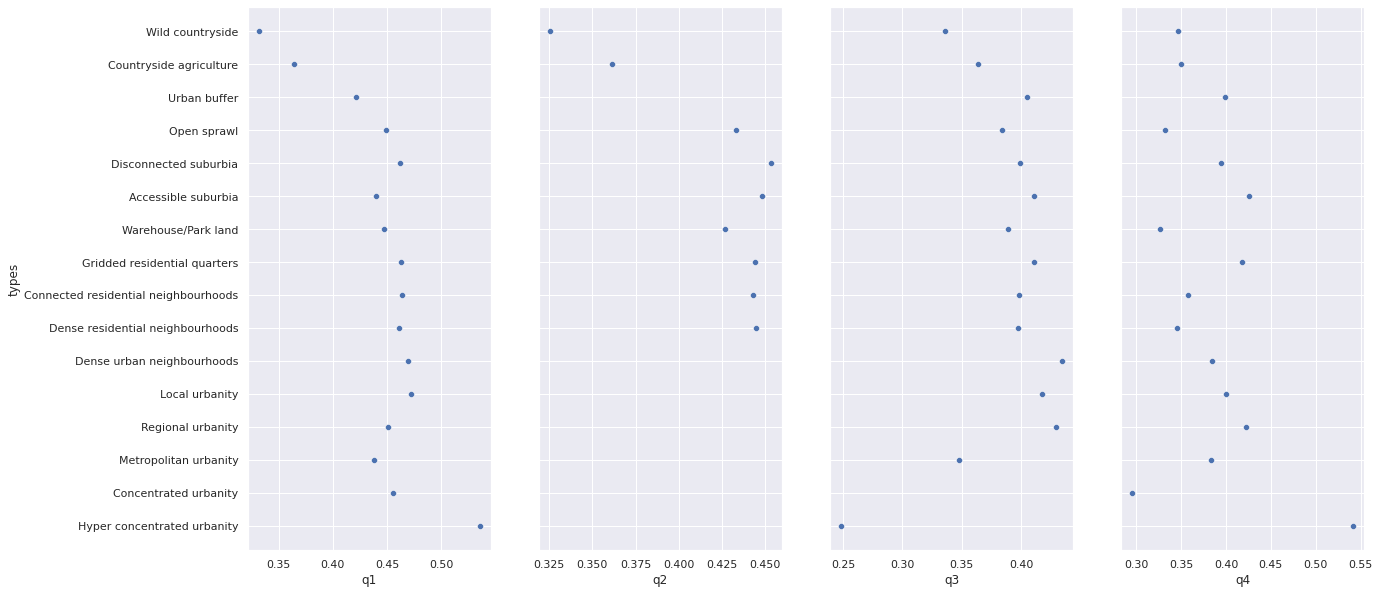
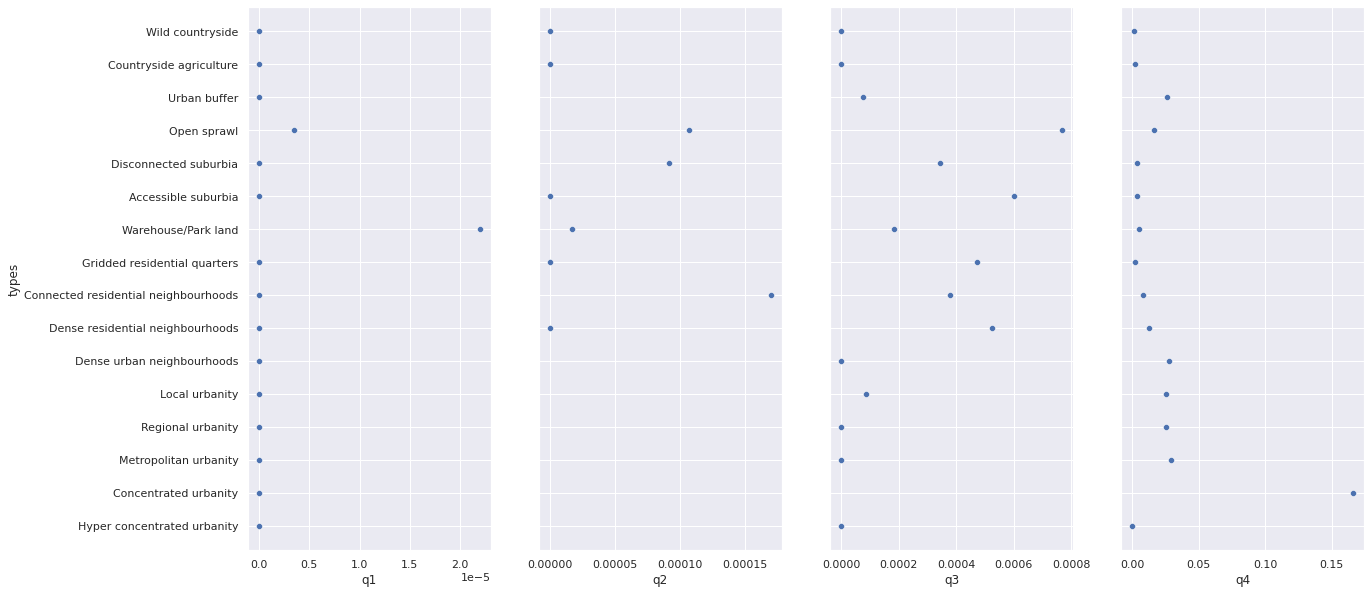
def plot_by_count_quartile(variable, log=False):
    plot_data = pandas.DataFrame(index=signatures.signature_type.cat.categories, columns=["q1", "q2", "q3", "q4"])
    plot_data.index.name = "types"
    for cat, q in product(signatures.signature_type.cat.categories, ["q1", "q2", "q3", "q4"]):
        plot_data.loc[cat, q] = signatures[(signatures.signature_type == cat) & (signatures.count_quartile == q)][variable].mean()

    fig, axs = plt.subplots(1, 4, figsize=(20, 10), sharey=True)
    axs = axs.flatten()
    for i, col in enumerate(plot_data):
        seaborn.scatterplot(data=plot_data, x=col, y="types", ax=axs[i])
        if log:
            axs[i].set_xscale('log')
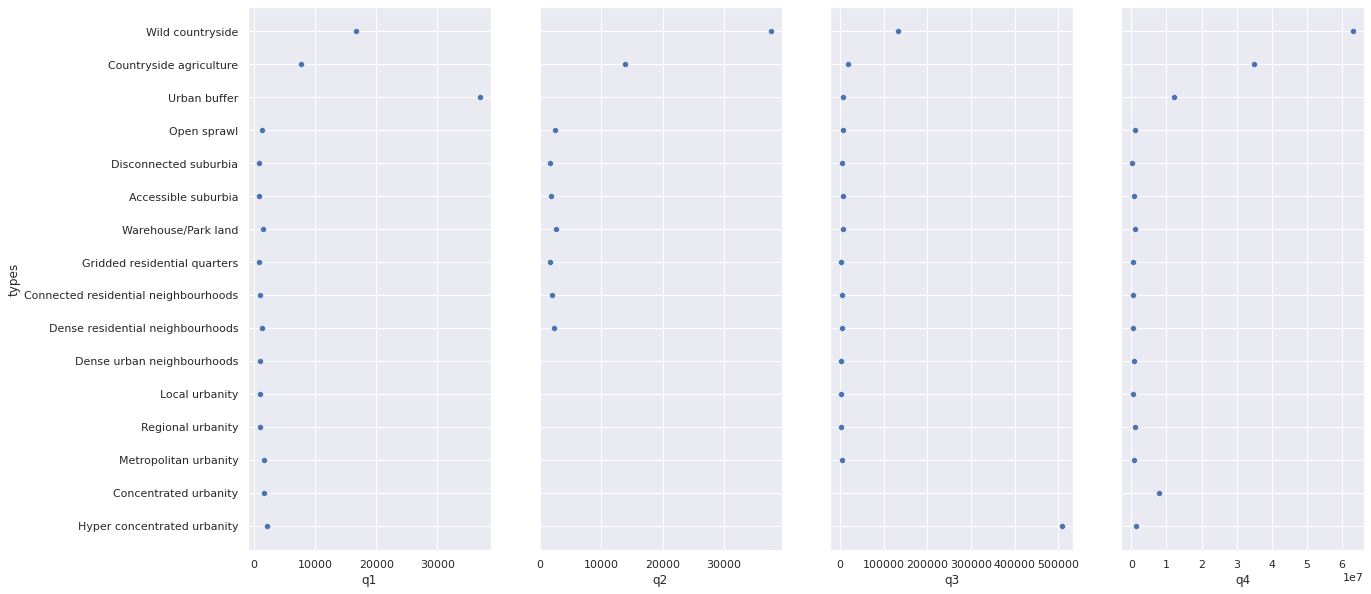
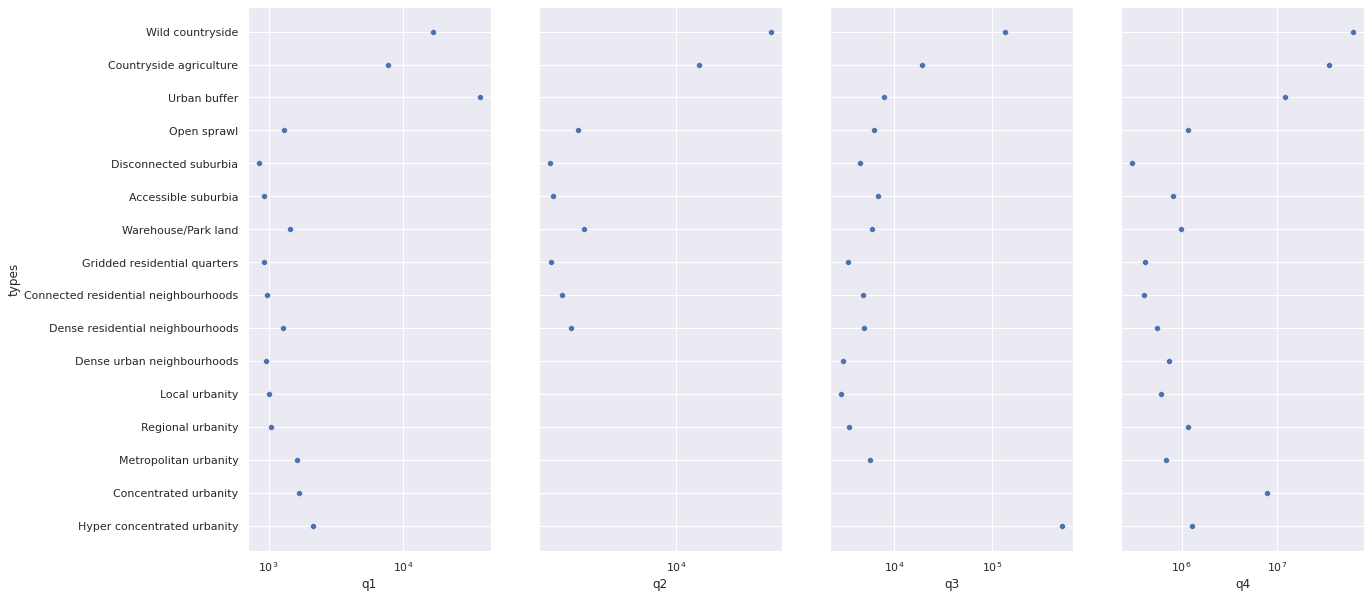
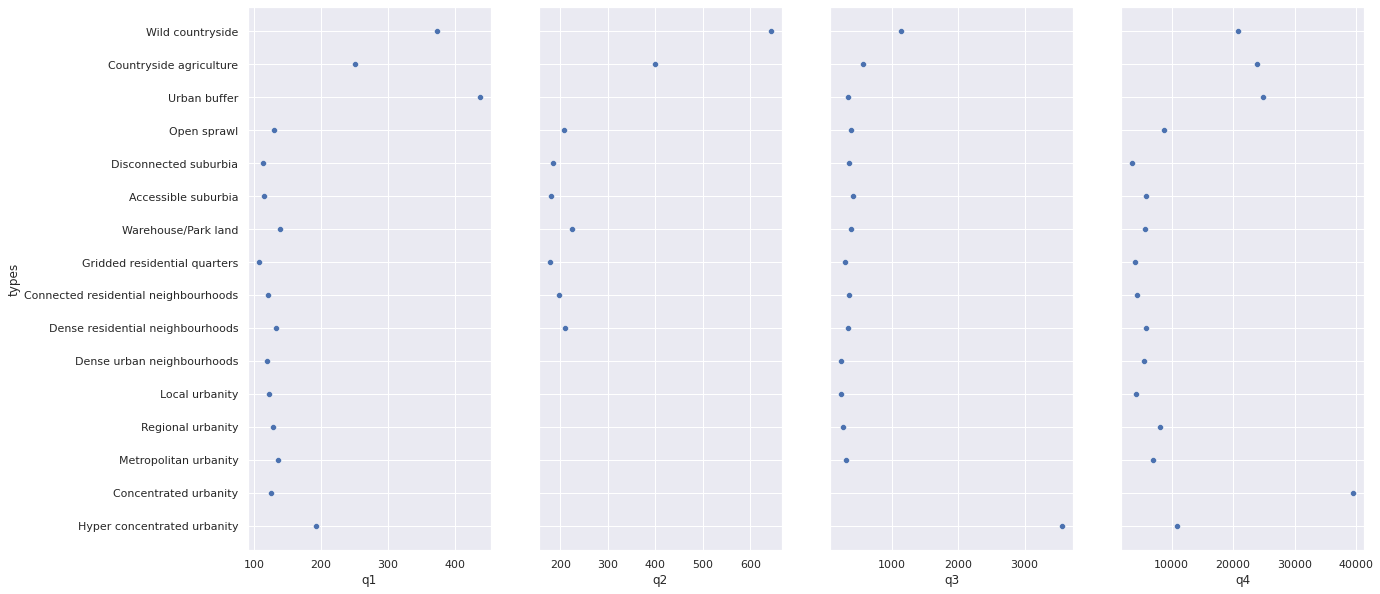
Perimeter by count
plot_by_count_quartile("perimeter")
plot_by_count_quartile("perimeter", log=True)
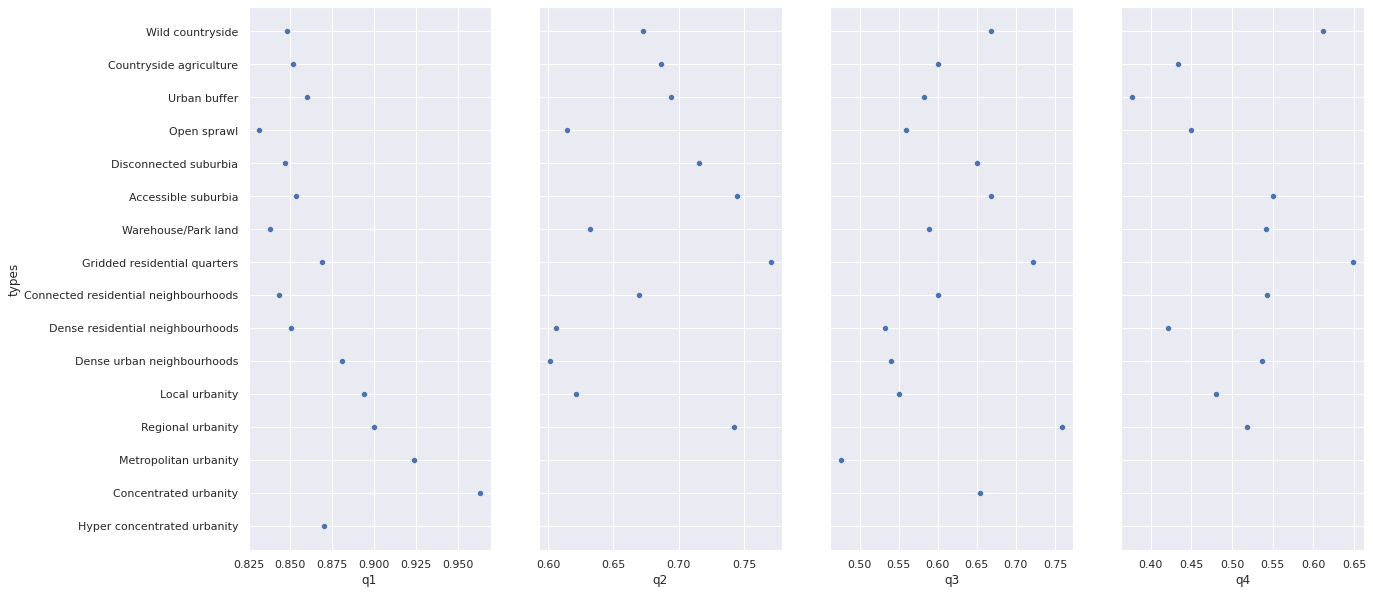
ERI by area
plot_by_count_quartile("eri")
Circlular compactness by count
plot_by_count_quartile("circular_compactness")
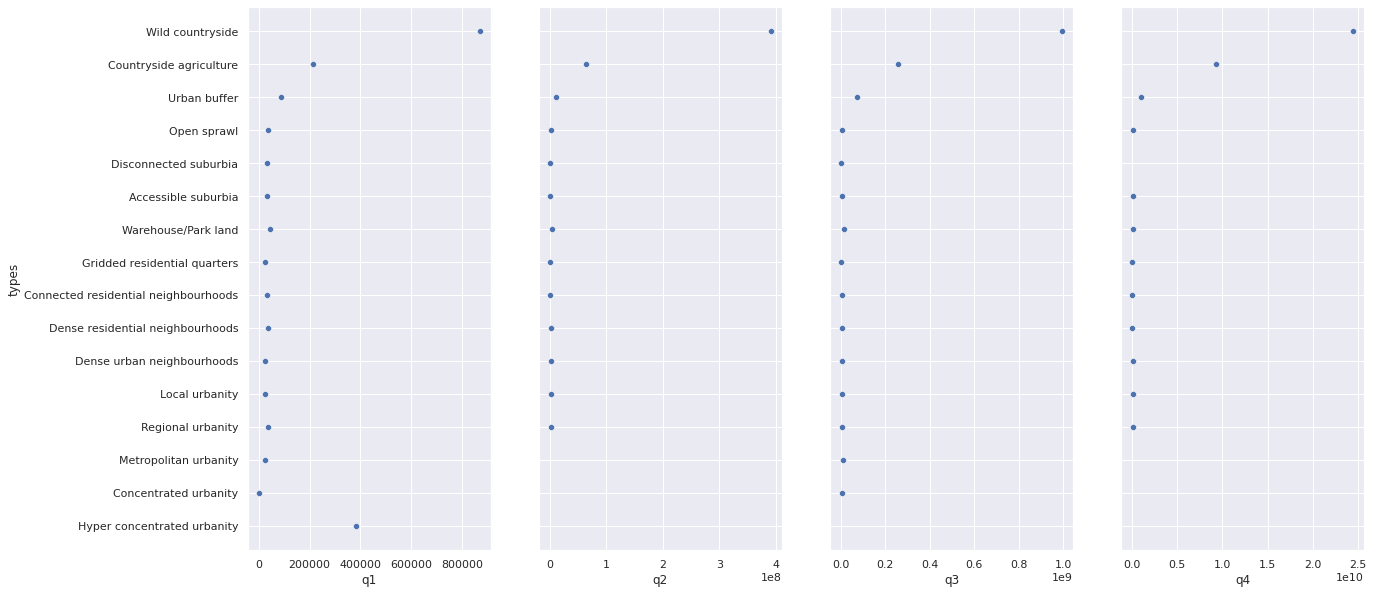
Donut index by count
plot_by_count_quartile("donut_index")
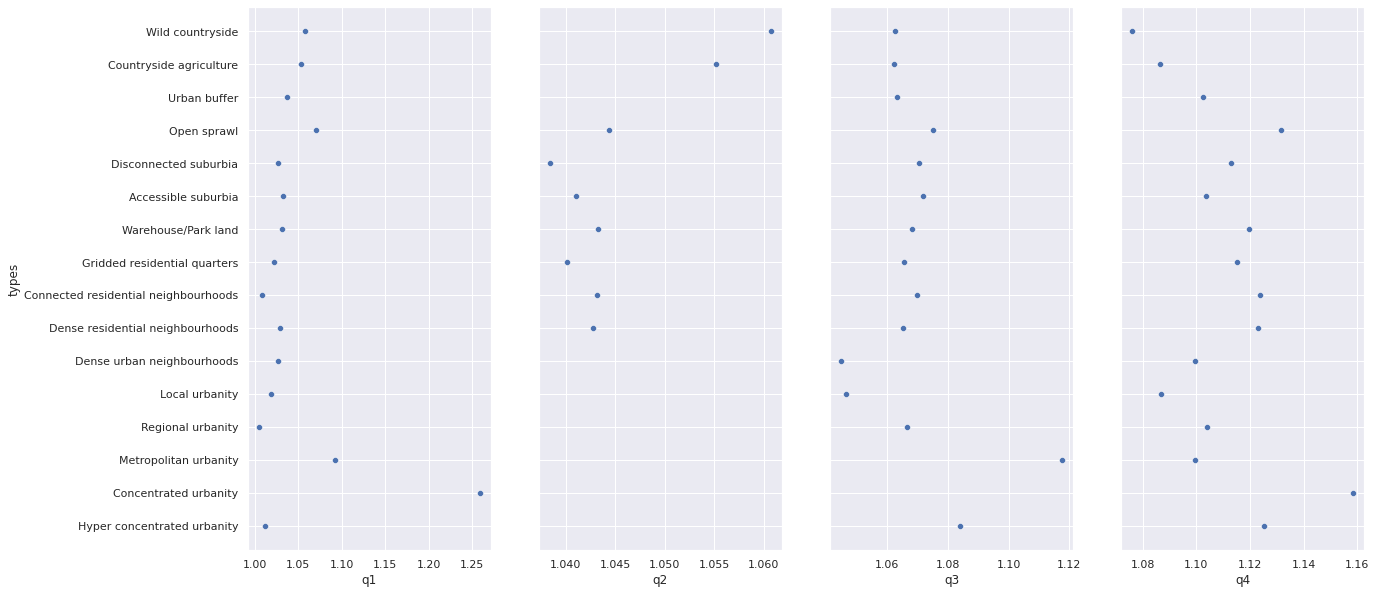
Fractality by count
plot_by_count_quartile("fractality")
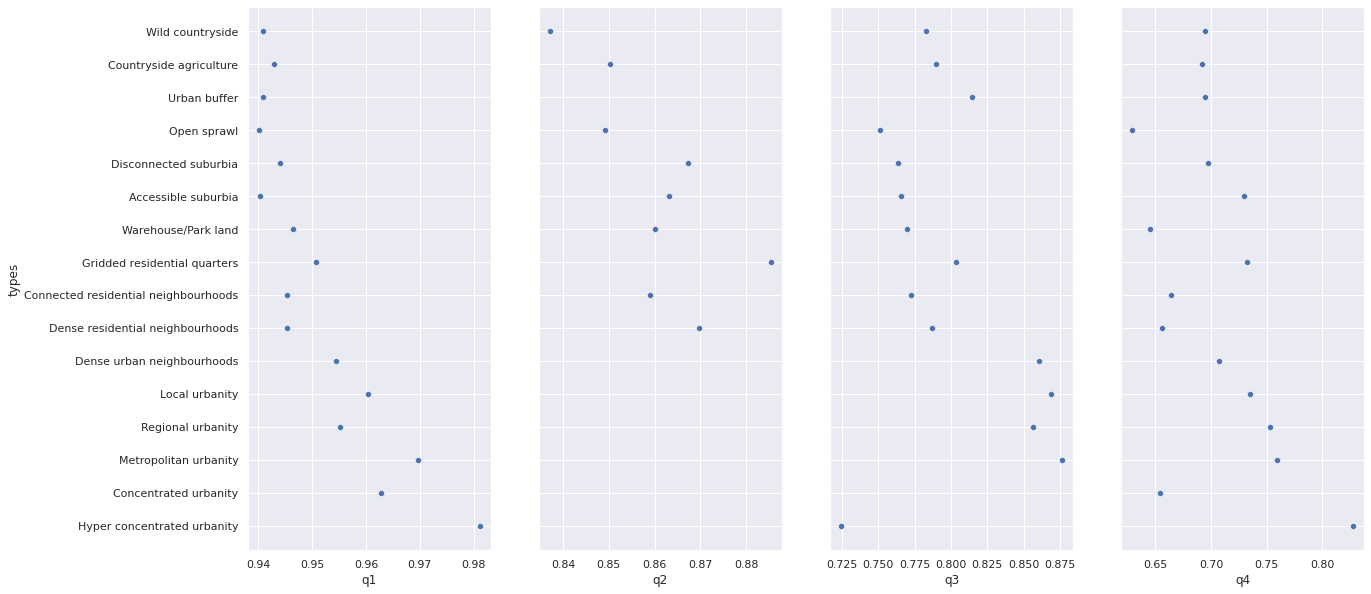
Convexity by count
plot_by_count_quartile("convexity")
Area quartiles
for cat in signatures.signature_type.cat.categories:
    mask = signatures.signature_type == cat
    desc = signatures[mask]["area"].describe()
    signatures.loc[mask, "area_quartile"] = pandas.cut(signatures[mask].cell_count, bins=[0, desc["25%"], desc["50%"], desc["75%"], desc['max']], labels=["q1", "q2", "q3", "q4"])
/opt/conda/lib/python3.8/site-packages/pandas/core/indexing.py:1599: SettingWithCopyWarning:
A value is trying to be set on a copy of a slice from a DataFrame.
Try using .loc[row_indexer,col_indexer] = value instead

See the caveats in the documentation: https://pandas.pydata.org/pandas-docs/stable/user_guide/indexing.html#returning-a-view-versus-a-copy
  self.obj[key] = infer_fill_value(value)
/opt/conda/lib/python3.8/site-packages/pandas/core/indexing.py:1676: SettingWithCopyWarning:
A value is trying to be set on a copy of a slice from a DataFrame.
Try using .loc[row_indexer,col_indexer] = value instead

See the caveats in the documentation: https://pandas.pydata.org/pandas-docs/stable/user_guide/indexing.html#returning-a-view-versus-a-copy
  self._setitem_single_column(ilocs[0], value, pi)
def plot_by_area_quartile(variable, log=False):
    plot_data = pandas.DataFrame(index=signatures.signature_type.cat.categories, columns=["q1", "q2", "q3", "q4"])
    plot_data.index.name = "types"
    for cat, q in product(signatures.signature_type.cat.categories, ["q1", "q2", "q3", "q4"]):
        plot_data.loc[cat, q] = signatures[(signatures.signature_type == cat) & (signatures.area_quartile == q)][variable].mean()

    fig, axs = plt.subplots(1, 4, figsize=(20, 10), sharey=True)
    axs = axs.flatten()
    for i, col in enumerate(plot_data):
        seaborn.scatterplot(data=plot_data, x=col, y="types", ax=axs[i])
        if log:
            axs[i].set_xscale('log')
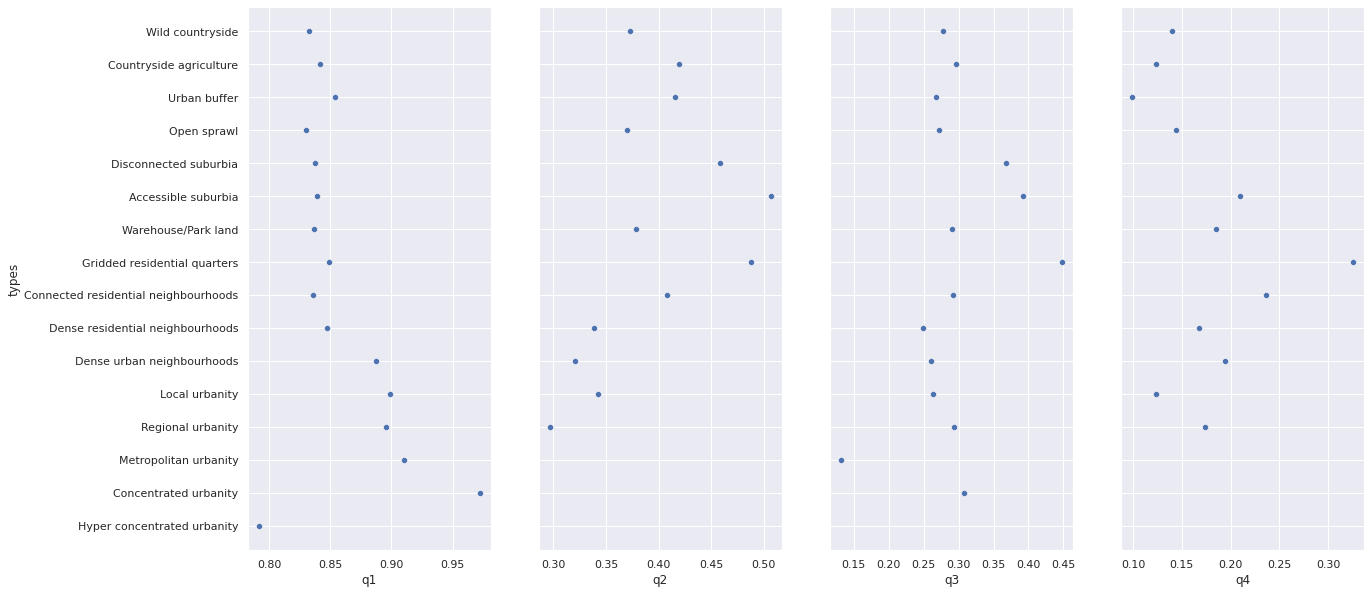
ERI by area
plot_by_area_quartile("eri")
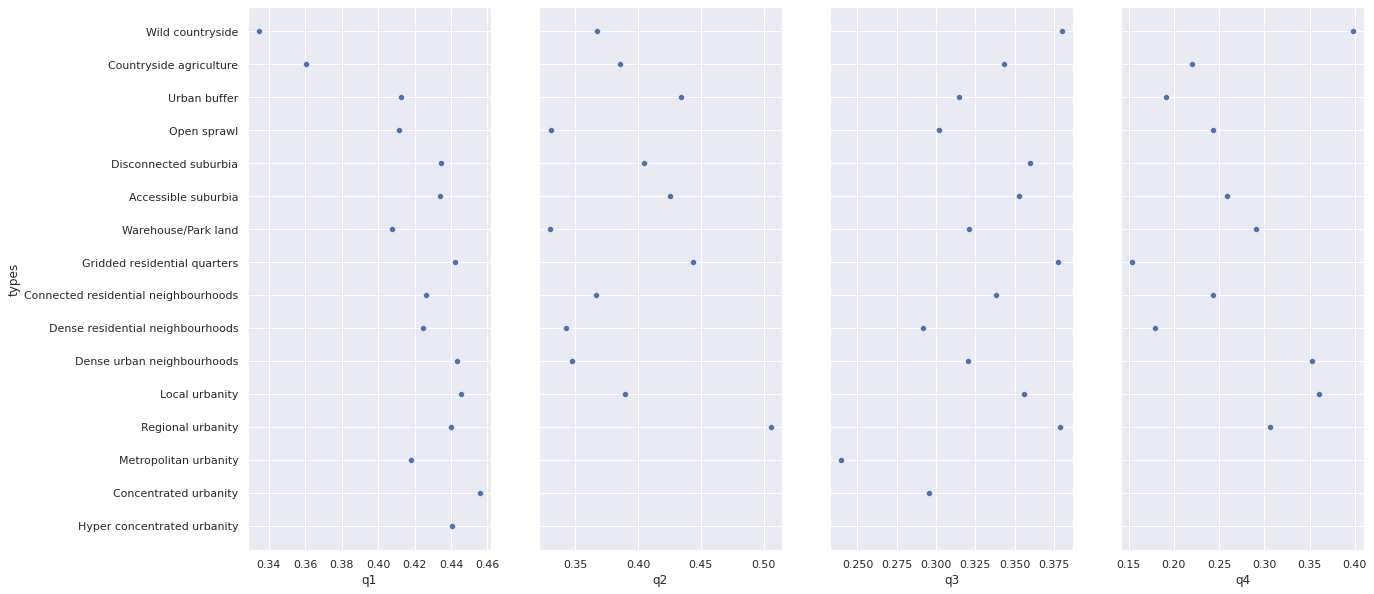
Circlular compactness by area
plot_by_area_quartile("circular_compactness")
Donut index by area
plot_by_area_quartile("donut_index")
Fractality by area
plot_by_area_quartile("fractality")
Convexity by area
plot_by_area_quartile("convexity")
