Exploration of form-based signatures
This notebook explored form-based signatures, trying to understand what individual clusters represent.
import numpy as np
import pandas as pd
import geopandas as gpd
import dask.dataframe
import matplotlib.pyplot as plt
import urbangrammar_graphics as ugg

from matplotlib.lines import Line2D
%time data = dask.dataframe.read_parquet("../../urbangrammar_samba/spatial_signatures/clustering_data/form/standardized/").replace([np.inf, -np.inf], np.nan).fillna(0)
%time data = data.compute().set_index('hindex')
CPU times: user 105 ms, sys: 138 ms, total: 244 ms
Wall time: 290 ms
CPU times: user 51.5 s, sys: 40.5 s, total: 1min 32s
Wall time: 1min 50s
labels_l1 = pd.read_parquet("../../urbangrammar_samba/spatial_signatures/clustering_data/k8_form_labels.pq")
labels_l2_4 = pd.read_parquet("../../urbangrammar_samba/spatial_signatures/clustering_data/clustergram_c4_form_labels.pq")
labels_l2_2 = pd.read_parquet("../../urbangrammar_samba/spatial_signatures/clustering_data/clustergram_c2_form_labels.pq")
labels = labels_l1.copy()
labels.loc[labels.k8 == 4, 'k8'] = labels_l2_4['9'].values + 40
labels.loc[labels.k8 == 2, 'k8'] = labels_l2_2['8'].values + 20
labels
| k8 | |
|---|---|
| hindex | |
| c000e094707t0000 | 0 |
| c000e094763t0000 | 5 |
| c000e094763t0001 | 5 |
| c000e094763t0002 | 5 |
| c000e094764t0000 | 5 |
| ... | ... |
| c102e644989t0111 | 5 |
| c102e644989t0112 | 5 |
| c102e644989t0113 | 5 |
| c102e644989t0114 | 5 |
| c102e644989t0115 | 5 |
14539578 rows × 1 columns
outliers = [6, 44, 48, 43]
mask = ~labels.k8.isin(outliers)
labels.columns = ["label"]
group = data.groupby(labels['label'].values).mean() # cluster centroids
group.columns.values
array(['sdbAre_q1', 'sdbAre_q2', 'sdbAre_q3', 'sdbPer_q1', 'sdbPer_q2',
       'sdbPer_q3', 'sdbCoA_q1', 'sdbCoA_q2', 'sdbCoA_q3', 'ssbCCo_q1',
       'ssbCCo_q2', 'ssbCCo_q3', 'ssbCor_q1', 'ssbCor_q2', 'ssbCor_q3',
       'ssbSqu_q1', 'ssbSqu_q2', 'ssbSqu_q3', 'ssbERI_q1', 'ssbERI_q2',
       'ssbERI_q3', 'ssbElo_q1', 'ssbElo_q2', 'ssbElo_q3', 'ssbCCM_q1',
       'ssbCCM_q2', 'ssbCCM_q3', 'ssbCCD_q1', 'ssbCCD_q2', 'ssbCCD_q3',
       'stbOri_q1', 'stbOri_q2', 'stbOri_q3', 'sdcLAL_q1', 'sdcLAL_q2',
       'sdcLAL_q3', 'sdcAre_q1', 'sdcAre_q2', 'sdcAre_q3', 'sscCCo_q1',
       'sscCCo_q2', 'sscCCo_q3', 'sscERI_q1', 'sscERI_q2', 'sscERI_q3',
       'stcOri_q1', 'stcOri_q2', 'stcOri_q3', 'sicCAR_q1', 'sicCAR_q2',
       'sicCAR_q3', 'stbCeA_q1', 'stbCeA_q2', 'stbCeA_q3', 'mtbAli_q1',
       'mtbAli_q2', 'mtbAli_q3', 'mtbNDi_q1', 'mtbNDi_q2', 'mtbNDi_q3',
       'mtcWNe_q1', 'mtcWNe_q2', 'mtcWNe_q3', 'mdcAre_q1', 'mdcAre_q2',
       'mdcAre_q3', 'ltcWRE_q1', 'ltcWRE_q2', 'ltcWRE_q3', 'ltbIBD_q1',
       'ltbIBD_q2', 'ltbIBD_q3', 'sdsSPW_q1', 'sdsSPW_q2', 'sdsSPW_q3',
       'sdsSWD_q1', 'sdsSWD_q2', 'sdsSWD_q3', 'sdsSPO_q1', 'sdsSPO_q2',
       'sdsSPO_q3', 'sdsLen_q1', 'sdsLen_q2', 'sdsLen_q3', 'sssLin_q1',
       'sssLin_q2', 'sssLin_q3', 'ldsMSL_q1', 'ldsMSL_q2', 'ldsMSL_q3',
       'mtdDeg_q1', 'mtdDeg_q2', 'mtdDeg_q3', 'lcdMes_q1', 'lcdMes_q2',
       'lcdMes_q3', 'linP3W_q1', 'linP3W_q2', 'linP3W_q3', 'linP4W_q1',
       'linP4W_q2', 'linP4W_q3', 'linPDE_q1', 'linPDE_q2', 'linPDE_q3',
       'lcnClo_q1', 'lcnClo_q2', 'lcnClo_q3', 'ldsCDL_q1', 'ldsCDL_q2',
       'ldsCDL_q3', 'xcnSCl_q1', 'xcnSCl_q2', 'xcnSCl_q3', 'mtdMDi_q1',
       'mtdMDi_q2', 'mtdMDi_q3', 'lddNDe_q1', 'lddNDe_q2', 'lddNDe_q3',
       'linWID_q1', 'linWID_q2', 'linWID_q3', 'stbSAl_q1', 'stbSAl_q2',
       'stbSAl_q3', 'sddAre_q1', 'sddAre_q2', 'sddAre_q3', 'sdsAre_q1',
       'sdsAre_q2', 'sdsAre_q3', 'sisBpM_q1', 'sisBpM_q2', 'sisBpM_q3',
       'misCel_q1', 'misCel_q2', 'misCel_q3', 'mdsAre_q1', 'mdsAre_q2',
       'mdsAre_q3', 'lisCel_q1', 'lisCel_q2', 'lisCel_q3', 'ldsAre_q1',
       'ldsAre_q2', 'ldsAre_q3', 'ltcRea_q1', 'ltcRea_q2', 'ltcRea_q3',
       'ltcAre_q1', 'ltcAre_q2', 'ltcAre_q3', 'ldeAre_q1', 'ldeAre_q2',
       'ldeAre_q3', 'ldePer_q1', 'ldePer_q2', 'ldePer_q3', 'lseCCo_q1',
       'lseCCo_q2', 'lseCCo_q3', 'lseERI_q1', 'lseERI_q2', 'lseERI_q3',
       'lseCWA_q1', 'lseCWA_q2', 'lseCWA_q3', 'lteOri_q1', 'lteOri_q2',
       'lteOri_q3', 'lteWNB_q1', 'lteWNB_q2', 'lteWNB_q3', 'lieWCe_q1',
       'lieWCe_q2', 'lieWCe_q3'], dtype=object)
sel = group[["sicCAR_q2", "lcdMes_q2", "sdcLAL_q2", "stbCeA_q1", "stcOri_q2", "linPDE_q2", "ssbCor_q3" ,"sdbAre_q3", "sddAre_q2"]]
sel = (sel-sel.min())/(sel.max()-sel.min())
sel
| sicCAR_q2 | lcdMes_q2 | sdcLAL_q2 | stbCeA_q1 | stcOri_q2 | linPDE_q2 | ssbCor_q3 | sdbAre_q3 | sddAre_q2 | |
|---|---|---|---|---|---|---|---|---|---|
| 0 | 0.326064 | 0.277856 | 0.240502 | 0.706473 | 0.871973 | 0.699971 | 1.119532e-02 | 0.042313 | 0.404416 |
| 1 | 0.482047 | 0.362348 | 0.083403 | 0.519900 | 0.829345 | 0.619649 | 1.669432e-02 | 0.067230 | 0.237370 |
| 3 | 0.305631 | 0.287905 | 0.312750 | 0.646587 | 0.965733 | 0.764049 | 1.568136e-02 | 0.036948 | 0.454185 |
| 5 | 0.413370 | 0.309513 | 0.127579 | 0.610906 | 0.831341 | 0.665396 | 1.290708e-02 | 0.051744 | 0.295283 |
| 6 | 0.464284 | 0.000000 | 0.210695 | 0.393272 | 0.000000 | 1.000000 | 3.361835e-18 | 0.177451 | 0.262379 |
| 7 | 0.000000 | 0.087568 | 1.000000 | 1.000000 | 1.000000 | 0.941431 | 1.647299e-16 | 0.065779 | 1.000000 |
| 20 | 0.551620 | 0.486684 | 0.062880 | 0.395459 | 0.723952 | 0.525718 | 2.955567e-02 | 0.088063 | 0.148939 |
| 21 | 0.565900 | 0.453098 | 0.053280 | 0.394376 | 0.818832 | 0.530562 | 5.949657e-02 | 0.150553 | 0.121038 |
| 22 | 0.560256 | 0.442562 | 0.047341 | 0.414214 | 0.744077 | 0.546407 | 2.617269e-02 | 0.108811 | 0.133056 |
| 23 | 0.550755 | 0.440602 | 0.053681 | 0.420885 | 0.874504 | 0.549118 | 2.954338e-02 | 0.109329 | 0.137769 |
| 24 | 0.575068 | 0.486899 | 0.043510 | 0.377864 | 0.842704 | 0.505271 | 3.586106e-02 | 0.099278 | 0.122654 |
| 25 | 0.553745 | 0.464867 | 0.059534 | 0.399977 | 0.840077 | 0.523696 | 3.411659e-02 | 0.121572 | 0.180358 |
| 26 | 0.550945 | 0.430609 | 0.049239 | 0.432253 | 0.804648 | 0.550894 | 2.826390e-02 | 0.090354 | 0.134050 |
| 27 | 0.650376 | 0.568312 | 0.028627 | 0.296350 | 0.799767 | 0.440345 | 1.847212e-01 | 0.258739 | 0.090640 |
| 40 | 0.682158 | 0.652837 | 0.043809 | 0.274658 | 0.797039 | 0.357952 | 3.051706e-01 | 0.386590 | 0.237481 |
| 41 | 0.930326 | 1.000000 | 0.021525 | 0.035035 | 0.585487 | 0.039694 | 5.286567e-01 | 0.783033 | 0.007037 |
| 42 | 0.706732 | 0.723045 | 0.038523 | 0.245126 | 0.842489 | 0.287014 | 4.257728e-01 | 0.443653 | 0.093988 |
| 43 | 0.026294 | 0.323674 | 0.715510 | 0.712914 | 0.998924 | 0.840615 | 0.000000e+00 | 0.015136 | 0.702403 |
| 44 | 0.582772 | 0.247936 | 0.000000 | 0.483896 | 0.379204 | 0.664963 | 6.723671e-18 | 0.070398 | 0.029880 |
| 45 | 0.761153 | 0.824085 | 0.022645 | 0.168886 | 0.785924 | 0.195078 | 3.679056e-01 | 0.473925 | 0.034220 |
| 46 | 1.000000 | 0.970814 | 0.027575 | 0.000000 | 0.782228 | 0.000000 | 1.000000e+00 | 1.000000 | 0.000428 |
| 47 | 0.953251 | 0.956072 | 0.029195 | 0.017098 | 0.655929 | 0.021849 | 9.829798e-01 | 0.907551 | 0.000000 |
| 48 | 0.219788 | 0.371201 | 0.238190 | 0.658567 | 0.754113 | 0.563664 | 1.008551e-17 | 0.000000 | 0.233776 |
cmap = ugg.get_colormap(len(sel), randomize=True)
len(sel)
23
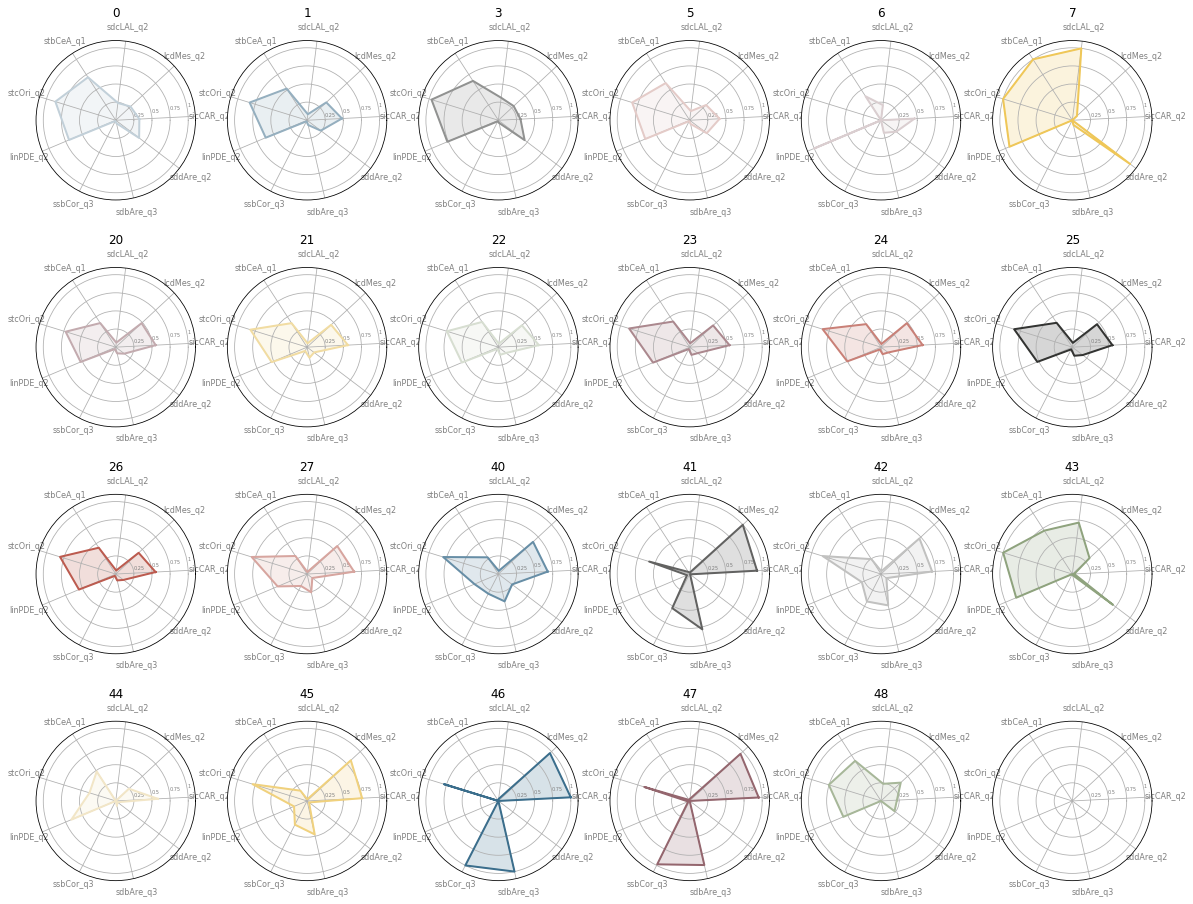
fig, axs = plt.subplots(4, 6, figsize=(20, 16), subplot_kw={'projection': 'polar'})

N = len(sel.columns)
angles = [(n / float(N) * 2 * np.pi)  + .05 for n in range(N)]
angles += angles[:1]

for i, ax in enumerate(axs.flatten()):
    try:
        ax.set_xticks(angles[:-1])
        ax.set_xticklabels(sel.columns, color='grey', size=8)
        ax.set_ylim(0, 1.1)
        ax.set_yticks([.25, .5, .75, 1])
        ax.set_yticklabels([.25, .5, .75, 1], color='grey', size=5)
        ax.set_rlabel_position(10)
        ax.set_title(sel.index[i])

        values = sel.iloc[i].values.flatten().tolist()
        values += values[:1]
        ax.plot(angles, values, linewidth=2, linestyle='solid', color=cmap.colors[i])
        ax.fill(angles, values, 'b', alpha=0.2, color=cmap.colors[i])
    except IndexError:
        continue

fig.set_facecolor('white')
fig, ax = plt.subplots(figsize=(10, 10), subplot_kw={'projection': 'polar'})
N = len(sel.columns)
angles = [(n / float(N) * 2 * np.pi) + .05 for n in range(N)]
angles += angles[:1]
ax.set_xticks(angles[:-1])
ax.set_xticklabels(sel.columns, color='grey', size=8)
ax.set_ylim(0, 1.1)
ax.set_yticks([.25, .5, .75, 1])
ax.set_yticklabels([.25, .5, .75, 1], color='grey', size=5)
ax.set_rlabel_position(10)
custom_points = []
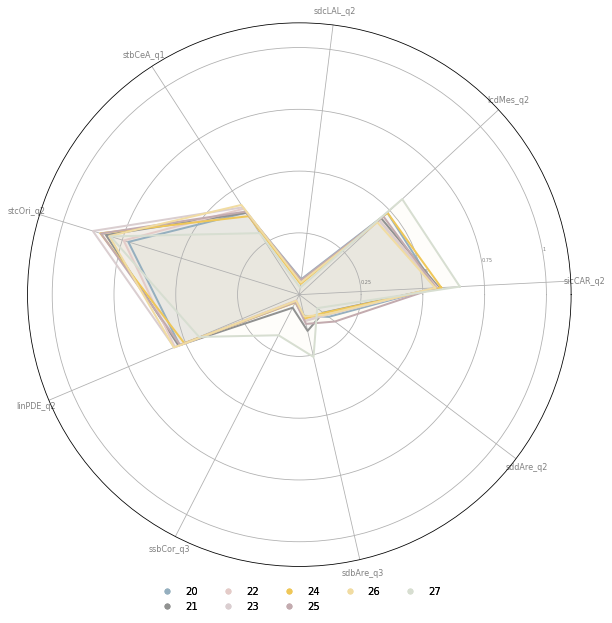
opts = [o for o in sel.index if str(o).startswith('2')]
for n, i in enumerate(opts):
values = sel.loc[i].values.flatten().tolist()
values += values[:1]
ax.plot(angles, values, linewidth=2, linestyle='solid', color=cmap.colors[n + 1])
ax.fill(angles, values, 'b', alpha=0.05, color=cmap.colors[n])
custom_points.append(Line2D([0], [0], marker="o", linestyle="none", markersize=5, color=cmap.colors[n + 1]))
fig.set_facecolor('white')
leg_points = ax.legend(custom_points, opts, loc='lower center', frameon=False, ncol=5, bbox_to_anchor=(0.5, -0.1))
ax.add_artist(leg_points)
<matplotlib.legend.Legend at 0x7f9ec5b064f0>
fig, ax = plt.subplots(figsize=(10, 10), subplot_kw={'projection': 'polar'})
cmap = ugg.get_colormap()
N = len(sel.columns)
angles = [(n / float(N) * 2 * np.pi) + .05 for n in range(N)]
angles += angles[:1]
ax.set_xticks(angles[:-1])
ax.set_xticklabels(sel.columns, color='grey', size=8)
ax.set_ylim(0, 1.1)
ax.set_yticks([.25, .5, .75, 1])
ax.set_yticklabels([.25, .5, .75, 1], color='grey', size=5)
ax.set_rlabel_position(10)
custom_points = []
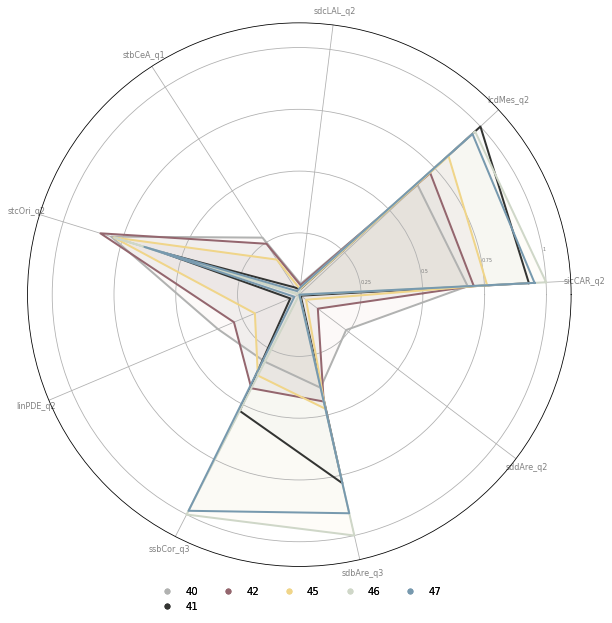
opts = [o for o in sel.index if str(o).startswith('4') and o not in [43, 44, 48]]
for n, i in enumerate(opts):
values = sel.loc[i].values.flatten().tolist()
values += values[:1]
ax.plot(angles, values, linewidth=2, linestyle='solid', color=cmap.colors[n + 1])
ax.fill(angles, values, 'b', alpha=0.05, color=cmap.colors[n])
custom_points.append(Line2D([0], [0], marker="o", linestyle="none", markersize=5, color=cmap.colors[n + 1]))
fig.set_facecolor('white')
leg_points = ax.legend(custom_points, opts, loc='lower center', frameon=False, ncol=5, bbox_to_anchor=(0.5, -0.1))
ax.add_artist(leg_points)
<matplotlib.legend.Legend at 0x7f9e25cb3fd0>
Summary
Countryside
Cluster 0
Large scale countryside without agriculture
Cluster 3
Even larger countryside (Highlands, Lowlands)
Cluster 5
Counstryside with agriculture
Cluster 7
yet another countryside class (one bit in Highlands)
Urban areas
Periphery
Cluster 1
Green belt area; urban periphery mixing with countryside, low density, small scale development
Outer parts
Cluster 2-5
Predominantly residential neighbourhoods with direct access to large urban green open spaces.
Cluster 2-2
peripheral, low density residential neighbourhoods; N-S orientation
Cluster 2-3
peripheral, low density residential neighbourhoods; rotated (45) orientation
Cluster 2-6
peripheral residential development. relatively well connected network with a low density, wide and open streets.
Cluster 2-0
relatively well connected but less granular than 2-6
Cluster 2-4
Compact peripheral neighbourhoods, potentially centers of peripheral districts with well connected networks
Cluster 2-7
Near center, still relatively dense development with slightly larger and more complex buildings
Cluster 2-1
peripheral development with a high ratio of large buildings, potentially of industrial origin
Centers
Central signatures (4-x) are organised in a pyramid way from less central to more. The gradient follows rising density, building area and building complexity.
Only larger cities have these signatures and can be organised based on the number of types present.
London is the only place to have all of them (4-6 and 4-7 are only in London). 4-1 is also in Birmingham, and very marginally in Manchester.
4-5 is more common (centers of Edinburgh and Glasgow, Bristol, Sheffield or Manchester) and 4-2 even more (centers of Liverpool or Southampton).