Cluster exploration and feature importance
This notebook assesses overall similarity of clusters based on Ward’s agglomerative clustering and uses Random Forest model to explore the importance of individual characters.
import numpy as np
import pandas as pd
import geopandas as gpd
import dask.dataframe
import matplotlib.pyplot as plt
import urbangrammar_graphics as ugg

from matplotlib.lines import Line2D
from sklearn.ensemble import RandomForestClassifier
%time standardized_form = dask.dataframe.read_parquet("../../urbangrammar_samba/spatial_signatures/clustering_data/form/standardized/").set_index('hindex')
%time stand_fn = dask.dataframe.read_parquet("../../urbangrammar_samba/spatial_signatures/clustering_data/function/standardized/")
%time data = dask.dataframe.multi.concat([standardized_form, stand_fn], axis=1).replace([np.inf, -np.inf], np.nan).fillna(0)
%time data = data.drop(columns=["keep_q1", "keep_q2", "keep_q3"])
%time data = data.compute()
CPU times: user 38.5 s, sys: 33.9 s, total: 1min 12s
Wall time: 1min 43s
CPU times: user 73.3 ms, sys: 81.5 ms, total: 155 ms
Wall time: 227 ms
CPU times: user 43.1 ms, sys: 6.71 ms, total: 49.8 ms
Wall time: 42.6 ms
CPU times: user 18.7 ms, sys: 0 ns, total: 18.7 ms
Wall time: 18.6 ms
CPU times: user 2min 42s, sys: 1min 28s, total: 4min 10s
Wall time: 2min 47s
data.info()
<class 'pandas.core.frame.DataFrame'>
Index: 14539578 entries, c000e094707t0000 to c102e644989t0115
Columns: 328 entries, sdbAre_q1 to Code_18_521_q3
dtypes: float64(328)
memory usage: 35.6+ GB
labels_l1 = pd.read_parquet("../../urbangrammar_samba/spatial_signatures/clustering_data/KMeans10GB.pq")
labels_l1
| kmeans10gb | |
|---|---|
| hindex | |
| c000e094707t0000 | 4 |
| c000e094763t0000 | 0 |
| c000e094763t0001 | 0 |
| c000e094763t0002 | 0 |
| c000e094764t0000 | 0 |
| ... | ... |
| c102e644989t0111 | 0 |
| c102e644989t0112 | 0 |
| c102e644989t0113 | 0 |
| c102e644989t0114 | 0 |
| c102e644989t0115 | 0 |
14539578 rows × 1 columns
labels_l2_9 = pd.read_parquet("../../urbangrammar_samba/spatial_signatures/clustering_data/clustergram_cl9_labels.pq")
labels_l2_9
| 1 | 2 | 3 | 4 | 5 | 6 | 7 | 8 | 9 | 10 | ... | 15 | 16 | 17 | 18 | 19 | 20 | 21 | 22 | 23 | 24 | |
|---|---|---|---|---|---|---|---|---|---|---|---|---|---|---|---|---|---|---|---|---|---|
| 0 | 0 | 0 | 0 | 0 | 0 | 0 | 0 | 0 | 0 | 0 | ... | 14 | 4 | 10 | 2 | 11 | 6 | 6 | 18 | 22 | 13 |
| 1 | 0 | 0 | 0 | 0 | 0 | 0 | 0 | 0 | 0 | 0 | ... | 14 | 4 | 10 | 2 | 11 | 6 | 6 | 18 | 22 | 13 |
| 2 | 0 | 0 | 0 | 0 | 0 | 0 | 0 | 0 | 0 | 0 | ... | 14 | 4 | 10 | 2 | 11 | 6 | 6 | 18 | 22 | 13 |
| 3 | 0 | 0 | 0 | 0 | 0 | 0 | 0 | 0 | 0 | 0 | ... | 14 | 4 | 10 | 2 | 11 | 6 | 6 | 18 | 22 | 13 |
| 4 | 0 | 0 | 0 | 0 | 0 | 0 | 0 | 0 | 0 | 0 | ... | 14 | 4 | 10 | 2 | 11 | 6 | 6 | 18 | 22 | 13 |
| ... | ... | ... | ... | ... | ... | ... | ... | ... | ... | ... | ... | ... | ... | ... | ... | ... | ... | ... | ... | ... | ... |
| 113639 | 0 | 0 | 0 | 0 | 0 | 0 | 0 | 0 | 0 | 0 | ... | 14 | 4 | 10 | 2 | 11 | 6 | 6 | 18 | 22 | 13 |
| 113640 | 0 | 0 | 0 | 0 | 0 | 0 | 0 | 0 | 0 | 0 | ... | 14 | 4 | 10 | 2 | 11 | 6 | 6 | 18 | 22 | 13 |
| 113641 | 0 | 0 | 0 | 0 | 0 | 0 | 0 | 0 | 0 | 0 | ... | 14 | 4 | 10 | 2 | 11 | 6 | 6 | 18 | 22 | 13 |
| 113642 | 0 | 0 | 0 | 0 | 0 | 0 | 0 | 0 | 0 | 0 | ... | 14 | 4 | 10 | 2 | 11 | 6 | 6 | 18 | 22 | 13 |
| 113643 | 0 | 0 | 0 | 0 | 0 | 0 | 0 | 0 | 0 | 0 | ... | 14 | 4 | 10 | 2 | 11 | 6 | 6 | 18 | 22 | 13 |
113644 rows × 24 columns
labels_l2_2 = pd.read_parquet("../../urbangrammar_samba/spatial_signatures/clustering_data/subclustering_cluster2_k3.pq")
labels_l2_2
| subclustering_cluster2_k3 | |
|---|---|
| hindex | |
| c000e097919t0003 | 1 |
| c000e097919t0005 | 1 |
| c000e097919t0008 | 1 |
| c000e097919t0009 | 1 |
| c000e097919t0015 | 1 |
| ... | ... |
| c102e639766t0007 | 0 |
| c102e639766t0010 | 0 |
| c102e639766t0011 | 0 |
| c102e639766t0012 | 0 |
| c102e639766t0013 | 0 |
1115564 rows × 1 columns
labels = labels_l1.copy()
labels.loc[labels.kmeans10gb == 9, 'kmeans10gb'] = labels_l2_9['9'].values + 90
labels.loc[labels.kmeans10gb == 2, 'kmeans10gb'] = labels_l2_2['subclustering_cluster2_k3'].values + 20
labels.kmeans10gb.value_counts()
7     3686554
0     3022385
3     2561211
1     1962830
5      707211
4      595902
8      564318
20     502835
21     374090
22     238639
6      209959
90      86380
92      21760
94       3739
91       1390
95        264
97         98
98          8
93          3
96          2
Name: kmeans10gb, dtype: int64
outliers = [98, 93, 96, 97]
mask = ~labels.kmeans10gb.isin(outliers)
Overall similarity
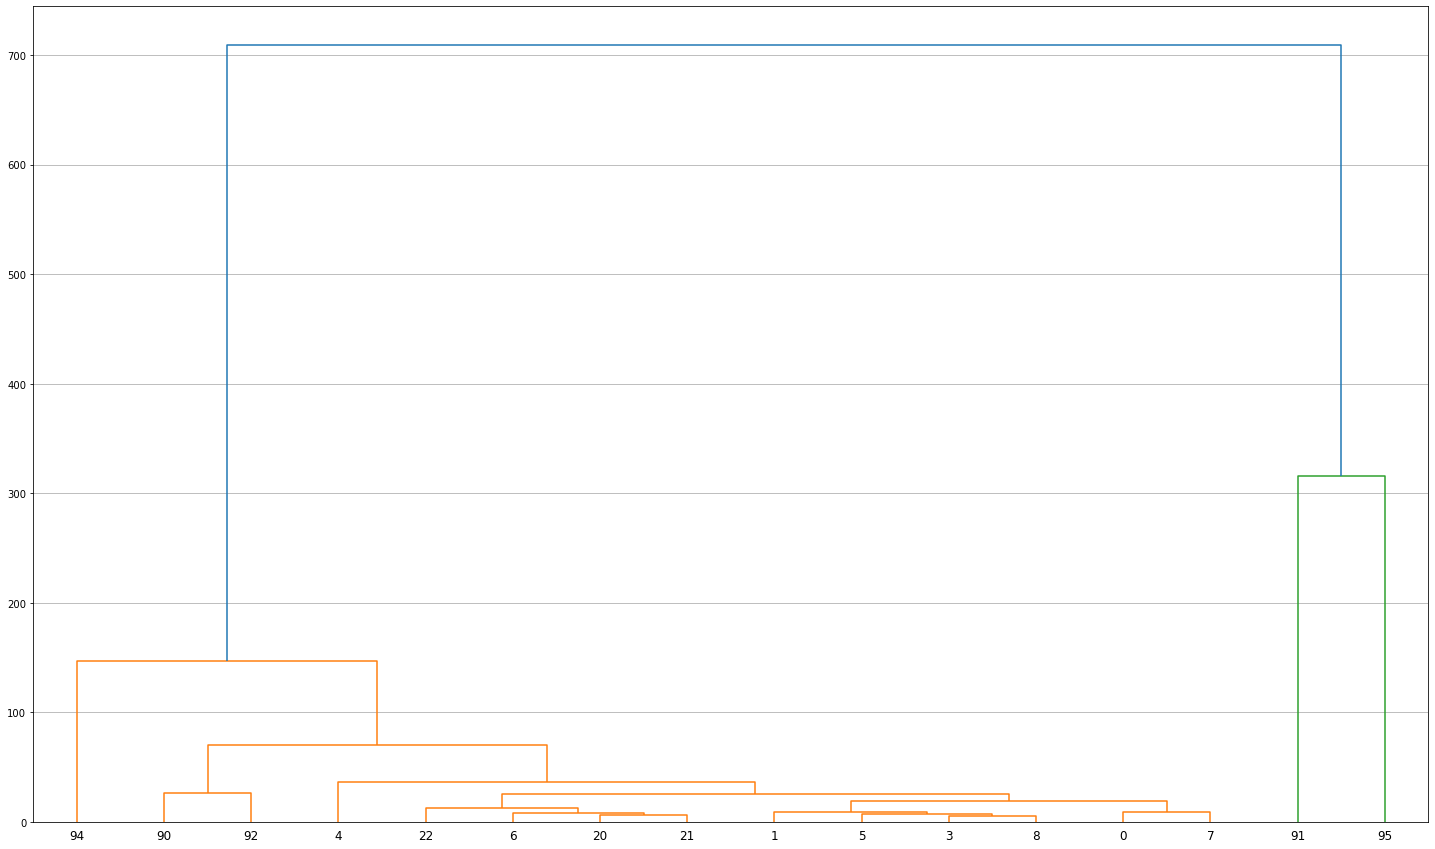
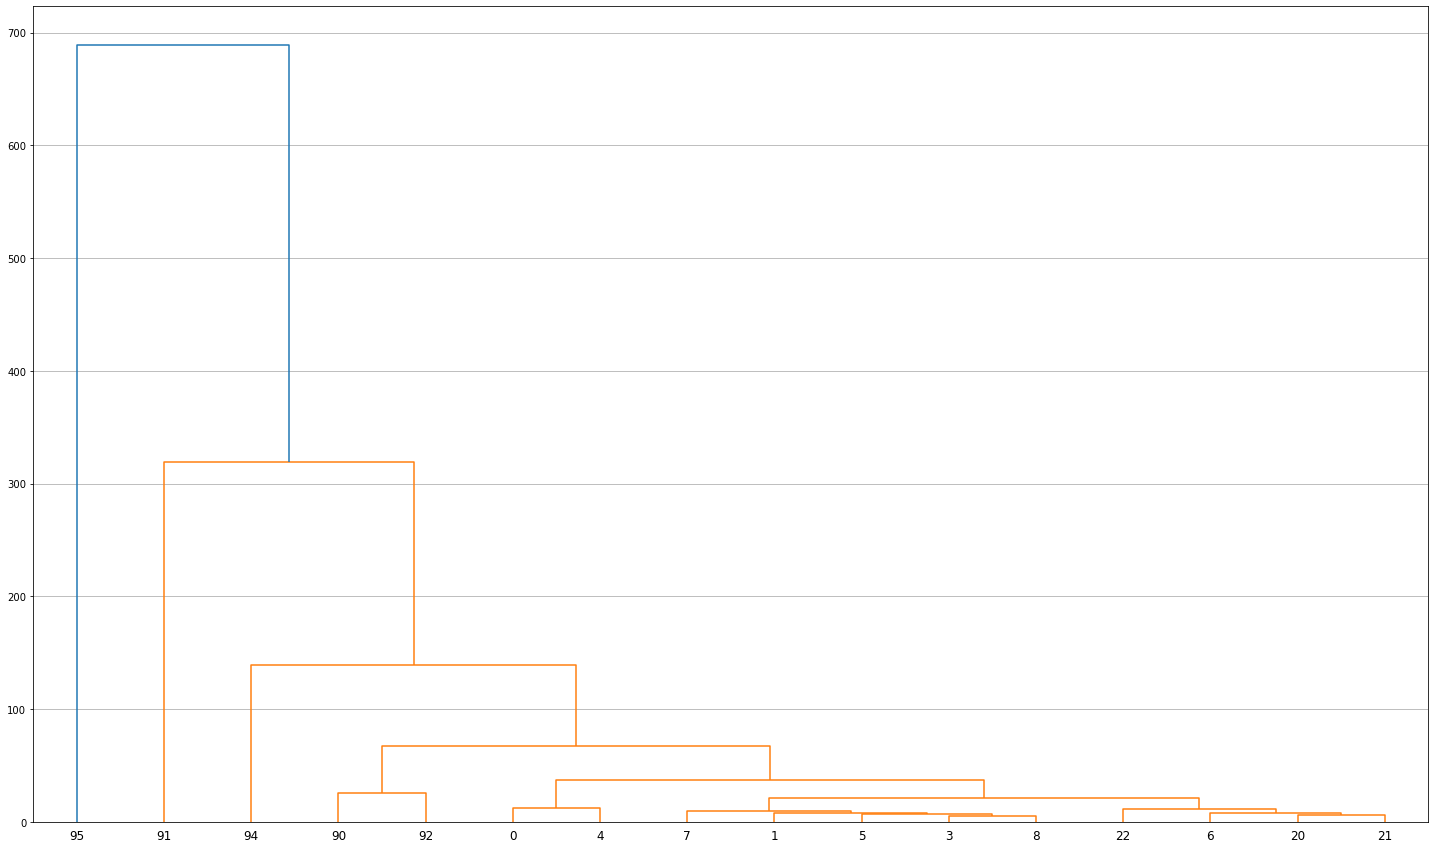
Similarity of clusters can be represented by hierarchical dendrogram generated using Ward’s agglomerative clustering.
from scipy.cluster import hierarchy

group = data.loc[mask].groupby(labels.loc[mask]['kmeans10gb'].values).mean() # cluster centroids
median = data.loc[mask].groupby(labels.loc[mask]['kmeans10gb'].values).median()
Z = hierarchy.linkage(group, 'ward')
fig, ax = plt.subplots(figsize=(25, 15))
dn = hierarchy.dendrogram(Z, labels=group.index)
plt.grid(True, axis='y', which='both')

Z = hierarchy.linkage(median, 'ward')
fig, ax = plt.subplots(figsize=(25, 15))
dn = hierarchy.dendrogram(Z, labels=group.index)
plt.grid(True, axis='y', which='both')

Global feature importance
Feature importance indicates which characters are more important in distinguishing between the signature types.
clf = RandomForestClassifier(n_estimators=100, n_jobs=-1, random_state=42, verbose=1)
%time clf = clf.fit(data.loc[mask].values, labels.loc[mask]['kmeans10gb'].values)
[Parallel(n_jobs=-1)]: Using backend ThreadingBackend with 16 concurrent workers.
[Parallel(n_jobs=-1)]: Done  18 tasks      | elapsed: 23.0min
CPU times: user 19h 19min 43s, sys: 2min 14s, total: 19h 21min 57s
Wall time: 1h 19min 23s
[Parallel(n_jobs=-1)]: Done 100 out of 100 | elapsed: 79.0min finished
# DO NOT RUN, KILLS THE KERNEL ON OUT OF MEMORY
# clf.score(data.loc[mask].values, labels.loc[mask]['kmeans10gb'].values)
[Parallel(n_jobs=16)]: Using backend ThreadingBackend with 16 concurrent workers.
importances = clf.feature_importances_
clf
RandomForestClassifier(n_jobs=-1, random_state=42, verbose=1)
std = np.std([clf.feature_importances_ for tree in clf.estimators_], axis=0)
to_plot = pd.DataFrame({"std": std, "imp": clf.feature_importances_}, index=data.columns).sort_values("imp", ascending=False)
to_plot
| std | imp | |
|---|---|---|
| sicCAR_q1 | 4.857226e-17 | 0.036944 |
| sicCAR_q2 | 7.632783e-17 | 0.031717 |
| mtcWNe_q2 | 3.122502e-17 | 0.023476 |
| ltbIBD_q2 | 1.040834e-17 | 0.016662 |
| sdcAre_q3 | 3.122502e-17 | 0.016005 |
| ... | ... | ... |
| Code_18_334_q2 | 0.000000e+00 | 0.000000 |
| Code_18_141_q1 | 0.000000e+00 | 0.000000 |
| Code_18_124_q1 | 0.000000e+00 | 0.000000 |
| Code_18_511_q2 | 0.000000e+00 | 0.000000 |
| Code_18_521_q3 | 0.000000e+00 | 0.000000 |
328 rows × 2 columns
to_plot['ff'] = pd.Series(to_plot.index).apply(lambda x: "form" if x in data.columns[:177] else "function").values
to_plot["q"] = pd.Series(to_plot.index).apply(lambda x: x[-2:]).values
to_plot.ff.isna().any()
False
import seaborn
seaborn.set()
fig, ax = plt.subplots(figsize=(8, 60))

seaborn.barplot(x='imp', y=to_plot.index, hue='ff', data=to_plot)
<AxesSubplot:xlabel='imp'>

importances = pd.Series(importances.flatten(), index=data.columns).sort_values(ascending=False)
importances.tail(50)
Code_18_512_q2    4.999057e-05
Code_18_512_q3    4.940122e-05
Code_18_211_q1    4.870476e-05
Code_18_243_q1    4.857090e-05
Code_18_122_q2    4.713622e-05
Code_18_122_q3    4.587244e-05
mtdDeg_q1         4.007576e-05
Code_18_111_q1    3.632193e-05
ssbCor_q2         2.848661e-05
Code_18_131_q3    2.597117e-05
Code_18_313_q3    2.332676e-05
Code_18_313_q1    2.211369e-05
Code_18_131_q2    2.180273e-05
Code_18_313_q2    2.172385e-05
Code_18_141_q3    1.715724e-05
Code_18_142_q3    1.472706e-05
Code_18_311_q3    1.048974e-05
xcnSCl_q2         8.842498e-06
Code_18_121_q1    7.240644e-06
mtdDeg_q2         4.812494e-06
Code_18_142_q2    3.522273e-06
sdbCoA_q3         1.751870e-06
lieWCe_q3         1.667145e-06
Code_18_142_q1    1.139103e-06
Code_18_311_q2    5.870861e-07
xcnSCl_q1         1.686649e-07
Code_18_141_q2    1.031014e-07
ssbCor_q1         1.004750e-07
sdbCoA_q1         6.751301e-08
sdbCoA_q2         3.984640e-08
Code_18_311_q1    1.889368e-08
Code_18_132_q1    0.000000e+00
Code_18_334_q3    0.000000e+00
Code_18_512_q1    0.000000e+00
Code_18_521_q1    0.000000e+00
Code_18_411_q1    0.000000e+00
Code_18_132_q2    0.000000e+00
Code_18_122_q1    0.000000e+00
Code_18_244_q2    0.000000e+00
Code_18_244_q1    0.000000e+00
Code_18_244_q3    0.000000e+00
Code_18_521_q2    0.000000e+00
Code_18_131_q1    0.000000e+00
Code_18_334_q1    0.000000e+00
Code_18_511_q1    0.000000e+00
Code_18_334_q2    0.000000e+00
Code_18_141_q1    0.000000e+00
Code_18_124_q1    0.000000e+00
Code_18_511_q2    0.000000e+00
Code_18_521_q3    0.000000e+00
dtype: float64
importances.iloc[150:200]
O,P,Q. Public administration, education and health_q3                                0.001755
mtbAli_q2                                                                            0.001747
mtbAli_q1                                                                            0.001720
F. Construction_q2                                                                   0.001702
ltcRea_q3                                                                            0.001690
K, L, M, N. Financial, real estate, professional and administrative activities_q2    0.001687
lseERI_q2                                                                            0.001680
lseCWA_q3                                                                            0.001677
H, J. Transport and communication_q3                                                 0.001675
F. Construction_q1                                                                   0.001672
sdsLen_q1                                                                            0.001650
sdbPer_q1                                                                            0.001636
ldePer_q3                                                                            0.001591
sssLin_q3                                                                            0.001587
sdsSPW_q3                                                                            0.001568
O,P,Q. Public administration, education and health_q2                                0.001543
H, J. Transport and communication_q2                                                 0.001519
C. Manufacturing_q3                                                                  0.001516
C. Manufacturing_q2                                                                  0.001488
mtbAli_q3                                                                            0.001486
Code_18_112_q1                                                                       0.001482
sdbAre_q1                                                                            0.001478
K, L, M, N. Financial, real estate, professional and administrative activities_q1    0.001452
sdsSWD_q1                                                                            0.001435
R, S, T, U. Other_q2                                                                 0.001433
linP3W_q2                                                                            0.001388
G, I. Distribution, hotels and restaurants_q1                                        0.001360
O,P,Q. Public administration, education and health_q1                                0.001359
linP3W_q3                                                                            0.001340
H, J. Transport and communication_q1                                                 0.001331
linP3W_q1                                                                            0.001307
lteWNB_q2                                                                            0.001300
A, B, D, E. Agriculture, energy and water_q2                                         0.001270
sssLin_q1                                                                            0.001265
C. Manufacturing_q1                                                                  0.001256
lteWNB_q3                                                                            0.001249
lseERI_q1                                                                            0.001228
R, S, T, U. Other_q1                                                                 0.001224
A, B, D, E. Agriculture, energy and water_q3                                         0.001211
sscERI_q3                                                                            0.001170
culture_nearest                                                                      0.001115
nearest_retail_centre                                                                0.001106
A, B, D, E. Agriculture, energy and water_q1                                         0.001077
lteWNB_q1                                                                            0.001068
lseCCo_q2                                                                            0.000898
fhrs_counts                                                                          0.000868
nearest_water                                                                        0.000867
lseCCo_q1                                                                            0.000848
lseCCo_q3                                                                            0.000825
ssbERI_q3                                                                            0.000796
dtype: float64
importances
sicCAR_q1         0.036944
sicCAR_q2         0.031717
mtcWNe_q2         0.023476
ltbIBD_q2         0.016662
sdcAre_q3         0.016005
                    ...
Code_18_334_q2    0.000000
Code_18_141_q1    0.000000
Code_18_124_q1    0.000000
Code_18_511_q2    0.000000
Code_18_521_q3    0.000000
Length: 328, dtype: float64
importances.to_csv("../../urbangrammar_samba/spatial_signatures/clustering_data/spsig_feature_importance.csv")
Extremes
To better understand the important characters, it is useful to check their actual values.
import seaborn as sns
import matplotlib.pyplot as plt

fig, ax = plt.subplots(figsize=(20, 200))
sns.heatmap(group.T, cmap="vlag", center=0, annot=True, cbar=False)
# plt.savefig("../../urbangrammar_samba/spatial_signatures/clustering_data/spsig_heatmap.pdf", bbox_inches="tight")
<AxesSubplot:>

fig, ax = plt.subplots(figsize=(20, 200))
sns.heatmap(group.T.iloc[:, :-4], cmap="vlag", center=0, annot=True, cbar=False)
plt.savefig("../../urbangrammar_samba/spatial_signatures/clustering_data/spsig_heatmap_no_centers.pdf", bbox_inches="tight")
