Composition of signatures within FUAs
import geopandas
import pandas
import tobler

from download import download

tobler.__version__
'0.9.0'
https://ghsl.jrc.ec.europa.eu/ghs_fua.php
url = "https://jeodpp.jrc.ec.europa.eu/ftp/jrc-opendata/GHSL/GHS_FUA_UCDB2015_GLOBE_R2019A/V1-0/GHS_FUA_UCDB2015_GLOBE_R2019A_54009_1K_V1_0.zip"
download(url, "../../urbangrammar_samba/spatial_signatures/esda/fua", kind='zip')
Creating data folder...
Downloading data from https://jeodpp.jrc.ec.europa.eu/ftp/jrc-opendata/GHSL/GHS_FUA_UCDB2015_GLOBE_R2019A/V1-0/GHS_FUA_UCDB2015_GLOBE_R2019A_54009_1K_V1_0.zip (2.9 MB)

file_sizes: 100%|██████████████████████████| 3.06M/3.06M [00:00<00:00, 10.7MB/s]
Extracting zip file...
Successfully downloaded / unzipped to ../../urbangrammar_samba/spatial_signatures/esda/fua
'../../urbangrammar_samba/spatial_signatures/esda/fua'
fua = geopandas.read_file("../../urbangrammar_samba/spatial_signatures/esda/fua/GHS_FUA_UCDB2015_GLOBE_R2019A_54009_1K_V1_0.gpkg")
fua
| eFUA_ID | UC_num | UC_IDs | eFUA_name | Commuting | Cntry_ISO | Cntry_name | FUA_area | UC_area | FUA_p_2015 | UC_p_2015 | Com_p_2015 | geometry | |
|---|---|---|---|---|---|---|---|---|---|---|---|---|---|
| 0 | 1.0 | 1.0 | 5959 | Herat | 1.0 | AFG | Afghanistan | 139.0 | 60.0 | 888811.175807 | 844574.564331 | 44236.611476 | MULTIPOLYGON (((5529000.000 4155000.000, 55310... |
| 1 | 192.0 | 1.0 | 5964 | Guzarah | 1.0 | AFG | Afghanistan | 32.0 | 16.0 | 169489.573231 | 160204.260864 | 9285.312366 | MULTIPOLYGON (((5541000.000 4139000.000, 55420... |
| 2 | 354.0 | 1.0 | 5968 | Shindand | 0.0 | AFG | Afghanistan | 12.0 | 12.0 | 147553.403870 | 147553.403870 | 0.000000 | MULTIPOLYGON (((5573000.000 4030000.000, 55740... |
| 3 | 505.0 | 1.0 | 5970 | Qala i Naw | 0.0 | AFG | Afghanistan | 3.0 | 3.0 | 79809.722656 | 79809.722656 | 0.000000 | MULTIPOLYGON (((5592000.000 4221000.000, 55900... |
| 4 | 648.0 | 1.0 | 5973 | Farah | 1.0 | AFG | Afghanistan | 32.0 | 16.0 | 131508.797060 | 122843.460327 | 8665.336733 | MULTIPOLYGON (((5607000.000 3923000.000, 56080... |
| ... | ... | ... | ... | ... | ... | ... | ... | ... | ... | ... | ... | ... | ... |
| 9026 | 1739.0 | 1.0 | 4191 | Triangle | 0.0 | ZWE | Zimbabwe | 5.0 | 5.0 | 61859.251465 | 61859.251465 | 0.000000 | MULTIPOLYGON (((3023000.000 -2577000.000, 3021... |
| 9027 | 1908.0 | 1.0 | 4206 | Glenclova | 0.0 | ZWE | Zimbabwe | 4.0 | 4.0 | 158476.038086 | 158476.038086 | 0.000000 | MULTIPOLYGON (((3033000.000 -2449000.000, 3032... |
| 9028 | 2062.0 | 1.0 | 4222 | Bindura | 1.0 | ZWE | Zimbabwe | 54.0 | 16.0 | 109737.644325 | 74992.162598 | 34745.481728 | MULTIPOLYGON (((3053000.000 -2126000.000, 3054... |
| 9029 | 2137.0 | 1.0 | 4236 | Marondera | 1.0 | ZWE | Zimbabwe | 23.0 | 12.0 | 61332.544647 | 52538.743042 | 8793.801605 | MULTIPOLYGON (((3067000.000 -2235000.000, 3065... |
| 9030 | 2211.0 | 1.0 | 4329 | Mutare | 1.0 | ZWE | Zimbabwe | 70.0 | 30.0 | 176620.319862 | 159616.356934 | 17003.962929 | MULTIPOLYGON (((3161000.000 -2326000.000, 3162... |
9031 rows × 13 columns
fua = fua[fua.Cntry_name == "UnitedKingdom"]
fua
| eFUA_ID | UC_num | UC_IDs | eFUA_name | Commuting | Cntry_ISO | Cntry_name | FUA_area | UC_area | FUA_p_2015 | UC_p_2015 | Com_p_2015 | geometry | |
|---|---|---|---|---|---|---|---|---|---|---|---|---|---|
| 8386 | 60.0 | 1.0 | 1636 | Londonderry/Derry | 1.0 | GBR | UnitedKingdom | 363.0 | 28.0 | 128224.622293 | 68343.046631 | 59881.575662 | MULTIPOLYGON (((-496000.000 6390000.000, -4990... |
| 8387 | 242.0 | 1.0 | 1667 | Belfast | 1.0 | GBR | UnitedKingdom | 2815.0 | 163.0 | 947014.057843 | 457659.460201 | 489354.597642 | MULTIPOLYGON (((-415000.000 6376000.000, -4140... |
| 8388 | 400.0 | 1.0 | 1678 | Bangor | 1.0 | GBR | UnitedKingdom | 188.0 | 20.0 | 111281.009014 | 56162.283081 | 55118.725933 | MULTIPOLYGON (((-397000.000 6353000.000, -3950... |
| 8389 | 547.0 | 1.0 | 1699 | Greenock | 1.0 | GBR | UnitedKingdom | 332.0 | 30.0 | 133356.813452 | 62837.366241 | 70519.447210 | MULTIPOLYGON (((-335000.000 6495000.000, -3340... |
| 8390 | 689.0 | 1.0 | 1703 | Ayr | 1.0 | GBR | UnitedKingdom | 822.0 | 24.0 | 233592.319291 | 52581.456146 | 181010.863144 | MULTIPOLYGON (((-328000.000 6453000.000, -3270... |
| ... | ... | ... | ... | ... | ... | ... | ... | ... | ... | ... | ... | ... | ... |
| 8472 | 5756.0 | 1.0 | 2004 | Folkestone | 1.0 | GBR | UnitedKingdom | 274.0 | 17.0 | 149802.013609 | 51534.110153 | 98267.903456 | MULTIPOLYGON (((98000.000 5998000.000, 102000.... |
| 8473 | 5770.0 | 1.0 | 2005 | Norwich | 1.0 | GBR | UnitedKingdom | 1764.0 | 55.0 | 447236.304343 | 181040.501953 | 266195.802390 | MULTIPOLYGON (((97000.000 6172000.000, 102000.... |
| 8474 | 5783.0 | 1.0 | 2012 | Margate | 1.0 | GBR | UnitedKingdom | 221.0 | 38.0 | 178354.010781 | 111282.014160 | 67071.996621 | MULTIPOLYGON (((108000.000 6011000.000, 106000... |
| 8475 | 5796.0 | 1.0 | 2032 | Great Yarmouth | 1.0 | GBR | UnitedKingdom | 306.0 | 23.0 | 108785.798981 | 62391.325546 | 46394.473434 | MULTIPOLYGON (((114000.000 6157000.000, 115000... |
| 8476 | 5809.0 | 1.0 | 2033 | Lowestoft | 1.0 | GBR | UnitedKingdom | 331.0 | 26.0 | 112307.117010 | 67433.741241 | 44873.375769 | MULTIPOLYGON (((129000.000 6134000.000, 130000... |
91 rows × 13 columns
fua = fua[~fua.eFUA_name.isin(["Londonderry/Derry", "Belfast", "Bangor"])].dissolve("eFUA_name") # resolve NI and Larbert split
fua
| geometry | eFUA_ID | UC_num | UC_IDs | Commuting | Cntry_ISO | Cntry_name | FUA_area | UC_area | FUA_p_2015 | UC_p_2015 | Com_p_2015 | |
|---|---|---|---|---|---|---|---|---|---|---|---|---|
| eFUA_name | ||||||||||||
| Aberdeen | POLYGON ((-140000.000 6622000.000, -139000.000... | 3949.0 | 1.0 | 1809 | 1.0 | GBR | UnitedKingdom | 974.0 | 57.0 | 327687.306892 | 190328.649094 | 137358.657798 |
| Ashford | POLYGON ((67000.000 6000000.000, 68000.000 600... | 5711.0 | 1.0 | 1995 | 1.0 | GBR | UnitedKingdom | 446.0 | 25.0 | 116216.862157 | 70754.109764 | 45462.752393 |
| Aylesbury | POLYGON ((-59000.000 6072000.000, -53000.000 6... | 5106.0 | 1.0 | 1889 | 1.0 | GBR | UnitedKingdom | 497.0 | 19.0 | 165086.576402 | 70392.995361 | 94693.581040 |
| Ayr | POLYGON ((-328000.000 6453000.000, -327000.000... | 689.0 | 1.0 | 1703 | 1.0 | GBR | UnitedKingdom | 822.0 | 24.0 | 233592.319291 | 52581.456146 | 181010.863144 |
| Basingstoke | POLYGON ((-92000.000 6017000.000, -89000.000 6... | 5000.0 | 1.0 | 1869 | 1.0 | GBR | UnitedKingdom | 822.0 | 31.0 | 211342.999925 | 98888.676636 | 112454.323289 |
| ... | ... | ... | ... | ... | ... | ... | ... | ... | ... | ... | ... | ... |
| Torquay | POLYGON ((-275000.000 5935000.000, -273000.000... | 1681.0 | 1.0 | 1726 | 1.0 | GBR | UnitedKingdom | 410.0 | 40.0 | 250214.879927 | 104449.665150 | 145765.214777 |
| Warwick | POLYGON ((-108000.000 6117000.000, -107000.000... | 4294.0 | 1.0 | 1833 | 1.0 | GBR | UnitedKingdom | 708.0 | 28.0 | 189492.056736 | 91138.653931 | 98353.402805 |
| Weston-super-Mare | POLYGON ((-212000.000 6024000.000, -211000.000... | 2508.0 | 1.0 | 1753 | 1.0 | GBR | UnitedKingdom | 459.0 | 28.0 | 187322.342065 | 79114.928507 | 108207.413558 |
| Worcester | POLYGON ((-155000.000 6102000.000, -154000.000... | 3760.0 | 1.0 | 1796 | 1.0 | GBR | UnitedKingdom | 637.0 | 30.0 | 223970.193714 | 98367.057617 | 125603.136097 |
| York | POLYGON ((-58000.000 6296000.000, -57000.000 6... | 5024.0 | 1.0 | 1874 | 1.0 | GBR | UnitedKingdom | 1086.0 | 40.0 | 276081.473475 | 146839.469574 | 129242.003901 |
88 rows × 12 columns
fua.to_parquet("../../urbangrammar_samba/spatial_signatures/esda/fua.pq")
/tmp/ipykernel_420981/3201103534.py:1: UserWarning: this is an initial implementation of Parquet/Feather file support and associated metadata.  This is tracking version 0.1.0 of the metadata specification at https://github.com/geopandas/geo-arrow-spec

This metadata specification does not yet make stability promises.  We do not yet recommend using this in a production setting unless you are able to rewrite your Parquet/Feather files.

To further ignore this warning, you can do:
import warnings; warnings.filterwarnings('ignore', message='.*initial implementation of Parquet.*')
  fua.to_parquet("../../urbangrammar_samba/spatial_signatures/esda/fua.pq")
fua = geopandas.read_parquet("../../urbangrammar_samba/spatial_signatures/esda/fua.pq")
signatures = geopandas.read_parquet("../../urbangrammar_samba/spatial_signatures/signatures/signatures_combined_levels_simplified.pq")
# drop an outlier island
signatures = signatures.drop(96691)
types = {
    "0_0": "Countryside agriculture",
    "1_0": "Accessible suburbia",
    "3_0": "Open sprawl",
    "4_0": "Wild countryside",
    "5_0": "Warehouse/Park land",
    "6_0": "Gridded residential quarters",
    "7_0": "Urban buffer",
    "8_0": "Disconnected suburbia",
    "2_0": "Dense residential neighbourhoods",
    "2_1": "Connected residential neighbourhoods",
    "2_2": "Dense urban neighbourhoods",
    "9_0": "Local urbanity",
    "9_1": "Concentrated urbanity",
    "9_2": "Regional urbanity",
    "9_4": "Metropolitan urbanity",
    "9_5": "Hyper concentrated urbanity",
}

signatures["signature_type"] = signatures["signature_type"].map(types)
signatures = signatures[["signature_type", "geometry"]].dropna()
fua = fua.to_crs(signatures.crs)
%%time
interpolated = tobler.area_weighted.area_interpolate(signatures, fua, categorical_variables=["signature_type"], n_jobs=1)
CPU times: user 26.8 s, sys: 68.5 ms, total: 26.9 s
Wall time: 26.9 s
interpolated.columns = [c[15:] if c != "geometry" else c for c in interpolated.columns]
interpolated["eFUA_name"] = fua.index.values
interpolated
| Countryside agriculture | Accessible suburbia | Open sprawl | Wild countryside | Warehouse/Park land | Gridded residential quarters | Urban buffer | Disconnected suburbia | Dense residential neighbourhoods | Connected residential neighbourhoods | Dense urban neighbourhoods | Local urbanity | Concentrated urbanity | Regional urbanity | Metropolitan urbanity | Hyper concentrated urbanity | geometry | eFUA_name | |
|---|---|---|---|---|---|---|---|---|---|---|---|---|---|---|---|---|---|---|
| 0 | 0.468477 | 0.005220 | 0.027675 | 0.257100 | 0.022771 | 0.001013 | 0.175328 | 0.000592 | 0.013168 | 0.006675 | 0.004019 | 0.002651 | 0.0 | 7.899303e-04 | 0.0 | 0.0 | POLYGON ((396554.928 831071.162, 397438.641 83... | Aberdeen |
| 1 | 0.792438 | 0.002350 | 0.020485 | 0.010379 | 0.006240 | 0.000156 | 0.161470 | 0.005389 | 0.001027 | 0.000063 | 0.000003 | 0.000000 | 0.0 | 0.000000e+00 | 0.0 | 0.0 | POLYGON ((602189.278 150124.384, 603122.280 15... | Ashford |
| 2 | 0.594360 | 0.002455 | 0.021155 | 0.000123 | 0.006748 | 0.000000 | 0.357481 | 0.013276 | 0.001616 | 0.002087 | 0.000700 | 0.000000 | 0.0 | 0.000000e+00 | 0.0 | 0.0 | POLYGON ((482806.424 224230.769, 488374.430 22... | Aylesbury |
| 3 | 0.501468 | 0.022157 | 0.016522 | 0.176886 | 0.024273 | 0.000057 | 0.186826 | 0.000690 | 0.004353 | 0.005485 | 0.000936 | 0.000540 | 0.0 | 0.000000e+00 | 0.0 | 0.0 | POLYGON ((231195.220 644361.282, 232093.134 64... | Ayr |
| 4 | 0.761136 | 0.001093 | 0.016944 | 0.020100 | 0.014514 | 0.000000 | 0.177885 | 0.006340 | 0.001947 | 0.000014 | 0.000027 | 0.000000 | 0.0 | 0.000000e+00 | 0.0 | 0.0 | POLYGON ((453434.478 164656.715, 456230.544 16... | Basingstoke |
| ... | ... | ... | ... | ... | ... | ... | ... | ... | ... | ... | ... | ... | ... | ... | ... | ... | ... | ... |
| 83 | 0.459776 | 0.021057 | 0.057665 | 0.000000 | 0.001896 | 0.017460 | 0.352002 | 0.012217 | 0.002042 | 0.000016 | 0.000754 | 0.000429 | 0.0 | 0.000000e+00 | 0.0 | 0.0 | POLYGON ((283655.593 77926.976, 285531.153 778... | Torquay |
| 84 | 0.758988 | 0.001588 | 0.020888 | 0.001150 | 0.007358 | 0.000081 | 0.197949 | 0.003104 | 0.006854 | 0.000392 | 0.001649 | 0.000000 | 0.0 | 0.000000e+00 | 0.0 | 0.0 | POLYGON ((436352.125 272287.416, 437276.849 27... | Warwick |
| 85 | 0.601651 | 0.016805 | 0.047726 | 0.001526 | 0.001523 | 0.000270 | 0.273466 | 0.007674 | 0.005740 | 0.000041 | 0.000464 | 0.000000 | 0.0 | 0.000000e+00 | 0.0 | 0.0 | POLYGON ((341492.027 172229.335, 342423.543 17... | Weston-super-Mare |
| 86 | 0.682591 | 0.014683 | 0.032913 | 0.008708 | 0.002392 | 0.000009 | 0.248869 | 0.003711 | 0.004114 | 0.000085 | 0.001473 | 0.000454 | 0.0 | 4.662308e-07 | 0.0 | 0.0 | POLYGON ((393165.300 255935.724, 394091.146 25... | Worcester |
| 87 | 0.778846 | 0.006016 | 0.019338 | 0.005078 | 0.002115 | 0.000000 | 0.177203 | 0.004220 | 0.002867 | 0.000859 | 0.002051 | 0.001406 | 0.0 | 0.000000e+00 | 0.0 | 0.0 | POLYGON ((477925.637 467990.574, 478836.596 46... | York |
88 rows × 18 columns
interpolated.to_parquet("../../urbangrammar_samba/spatial_signatures/esda/fua_interpolated.pq")
/tmp/ipykernel_420981/215554984.py:1: UserWarning: this is an initial implementation of Parquet/Feather file support and associated metadata.  This is tracking version 0.1.0 of the metadata specification at https://github.com/geopandas/geo-arrow-spec

This metadata specification does not yet make stability promises.  We do not yet recommend using this in a production setting unless you are able to rewrite your Parquet/Feather files.

To further ignore this warning, you can do:
import warnings; warnings.filterwarnings('ignore', message='.*initial implementation of Parquet.*')
  interpolated.to_parquet("../../urbangrammar_samba/spatial_signatures/esda/fua_interpolated.pq")
interpolated = geopandas.read_parquet("../../urbangrammar_samba/spatial_signatures/esda/fua_interpolated.pq")
interpolated = interpolated.set_index("eFUA_name")
import matplotlib.pyplot as plt
import urbangrammar_graphics as ugg
plot_data = interpolated.T.drop(["geometry"])
plot_data
| eFUA_name | Aberdeen | Ashford | Aylesbury | Ayr | Basingstoke | Bedford | Birmingham | Blackburn | Blackpool | Blackwater | ... | Stoke-on-Trent | Swansea | Swindon | Taunton | Telford | Torquay | Warwick | Weston-super-Mare | Worcester | York |
|---|---|---|---|---|---|---|---|---|---|---|---|---|---|---|---|---|---|---|---|---|---|
| Countryside agriculture | 0.468477 | 0.792438 | 0.59436 | 0.501468 | 0.761136 | 0.420932 | 0.321044 | 0.368766 | 0.281667 | 0.41688 | ... | 0.525861 | 0.277877 | 0.833133 | 0.801086 | 0.711197 | 0.459776 | 0.758988 | 0.601651 | 0.682591 | 0.778846 |
| Accessible suburbia | 0.00522 | 0.00235 | 0.002455 | 0.022157 | 0.001093 | 0.010153 | 0.036182 | 0.007712 | 0.140768 | 0.017973 | ... | 0.04122 | 0.01743 | 0.001827 | 0.001379 | 0.003193 | 0.021057 | 0.001588 | 0.016805 | 0.014683 | 0.006016 |
| Open sprawl | 0.027675 | 0.020485 | 0.021155 | 0.016522 | 0.016944 | 0.031639 | 0.098189 | 0.083923 | 0.079557 | 0.123921 | ... | 0.05946 | 0.041449 | 0.023318 | 0.033191 | 0.07283 | 0.057665 | 0.020888 | 0.047726 | 0.032913 | 0.019338 |
| Wild countryside | 0.2571 | 0.010379 | 0.000123 | 0.176886 | 0.0201 | 0.000271 | 0.001096 | 0.085286 | 0.0 | 0.0 | ... | 0.024821 | 0.020823 | 0.001921 | 0.005899 | 0.00963 | 0.0 | 0.00115 | 0.001526 | 0.008708 | 0.005078 |
| Warehouse/Park land | 0.022771 | 0.00624 | 0.006748 | 0.024273 | 0.014514 | 0.004346 | 0.192086 | 0.026957 | 0.008568 | 0.027476 | ... | 0.008652 | 0.015282 | 0.006343 | 0.000582 | 0.013964 | 0.001896 | 0.007358 | 0.001523 | 0.002392 | 0.002115 |
| Gridded residential quarters | 0.001013 | 0.000156 | 0.0 | 0.000057 | 0.0 | 0.000029 | 0.000096 | 0.017656 | 0.106125 | 0.0 | ... | 0.018814 | 0.009396 | 0.000418 | 0.0 | 0.0 | 0.01746 | 0.000081 | 0.00027 | 0.000009 | 0.0 |
| Urban buffer | 0.175328 | 0.16147 | 0.357481 | 0.186826 | 0.177885 | 0.518984 | 0.243663 | 0.351137 | 0.268043 | 0.387318 | ... | 0.303327 | 0.565439 | 0.121925 | 0.146105 | 0.184388 | 0.352002 | 0.197949 | 0.273466 | 0.248869 | 0.177203 |
| Disconnected suburbia | 0.000592 | 0.005389 | 0.013276 | 0.00069 | 0.00634 | 0.005282 | 0.03605 | 0.001384 | 0.000172 | 0.023926 | ... | 0.002936 | 0.001013 | 0.006562 | 0.004286 | 0.004788 | 0.012217 | 0.003104 | 0.007674 | 0.003711 | 0.00422 |
| Dense residential neighbourhoods | 0.013168 | 0.001027 | 0.001616 | 0.004353 | 0.001947 | 0.004564 | 0.027543 | 0.024933 | 0.004334 | 0.002409 | ... | 0.010294 | 0.0028 | 0.003296 | 0.003498 | 0.0 | 0.002042 | 0.006854 | 0.00574 | 0.004114 | 0.002867 |
| Connected residential neighbourhoods | 0.006675 | 0.000063 | 0.002087 | 0.005485 | 0.000014 | 0.001761 | 0.023219 | 0.022438 | 0.000877 | 0.000042 | ... | 0.001383 | 0.001339 | 0.000086 | 0.000058 | 0.0 | 0.000016 | 0.000392 | 0.000041 | 0.000085 | 0.000859 |
| Dense urban neighbourhoods | 0.004019 | 0.000003 | 0.0007 | 0.000936 | 0.000027 | 0.001921 | 0.015444 | 0.009011 | 0.0 | 0.000057 | ... | 0.003226 | 0.001152 | 0.001028 | 0.001144 | 0.0 | 0.000754 | 0.001649 | 0.000464 | 0.001473 | 0.002051 |
| Local urbanity | 0.002651 | 0.0 | 0.0 | 0.00054 | 0.0 | 0.000118 | 0.003214 | 0.00074 | 0.000733 | 0.0 | ... | 0.000007 | 0.000912 | 0.000003 | 0.000005 | 0.0 | 0.000429 | 0.0 | 0.0 | 0.000454 | 0.001406 |
| Concentrated urbanity | 0.0 | 0.0 | 0.0 | 0.0 | 0.0 | 0.0 | 0.0 | 0.0 | 0.0 | 0.0 | ... | 0.0 | 0.0 | 0.0 | 0.0 | 0.0 | 0.0 | 0.0 | 0.0 | 0.0 | 0.0 |
| Regional urbanity | 0.00079 | 0.0 | 0.0 | 0.0 | 0.0 | 0.0 | 0.001571 | 0.0 | 0.0 | 0.0 | ... | 0.0 | 0.000106 | 0.0 | 0.0 | 0.0 | 0.0 | 0.0 | 0.0 | 0.0 | 0.0 |
| Metropolitan urbanity | 0.0 | 0.0 | 0.0 | 0.0 | 0.0 | 0.0 | 0.000602 | 0.0 | 0.0 | 0.0 | ... | 0.0 | 0.0 | 0.0 | 0.0 | 0.0 | 0.0 | 0.0 | 0.0 | 0.0 | 0.0 |
| Hyper concentrated urbanity | 0.0 | 0.0 | 0.0 | 0.0 | 0.0 | 0.0 | 0.0 | 0.0 | 0.0 | 0.0 | ... | 0.0 | 0.0 | 0.0 | 0.0 | 0.0 | 0.0 | 0.0 | 0.0 | 0.0 | 0.0 |
16 rows × 88 columns
cmap = ugg.get_colormap(20, randomize=False)
cols = cmap.colors

symbology = {'0_0': cols[16],
             '1_0': cols[15],
             '3_0': cols[9],
             '4_0': cols[12],
             '5_0': cols[21],
             '6_0': cols[8],
             '7_0': cols[4],
             '8_0': cols[18],
             '2_0': cols[6],
             '2_1': cols[23],
             '2_2': cols[19],
             '9_0': cols[7],
             '9_1': cols[3],
             '9_2': cols[22],
             '9_4': cols[11],
             '9_5': cols[14],
            }
symbology = {types[k]:v for k, v in symbology.items()}
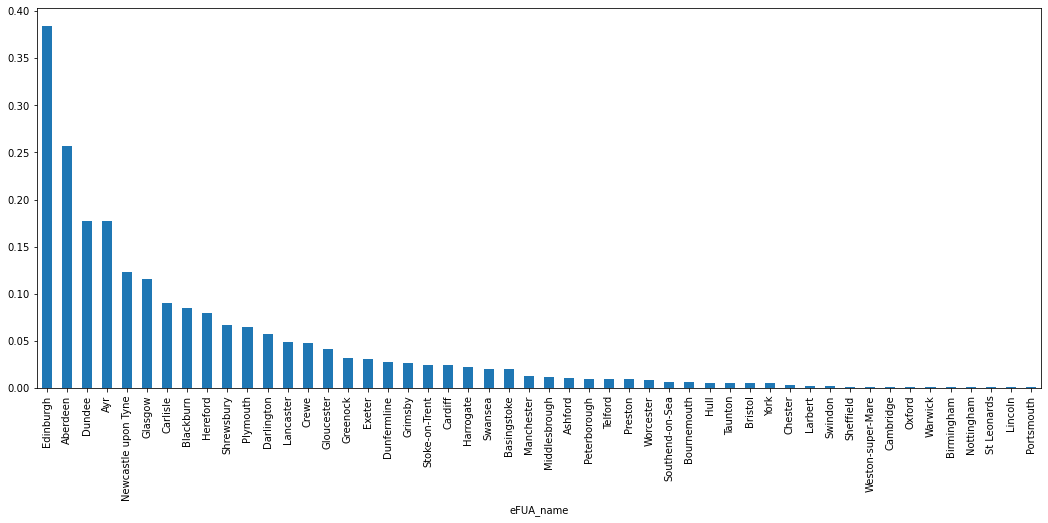
plot_data.T["Wild countryside"].sort_values(ascending=False).iloc[:50].plot.bar(figsize=(18, 7))
<AxesSubplot:xlabel='eFUA_name'>
for sig in plot_data.index:

    ax = interpolated.plot(sig, figsize=(15, 15), legend=True)
    ax.axis('off')
    plt.savefig(f"../../urbangrammar_samba/spatial_signatures/esda/fua_maps/{sig}.png")
    plt.close()
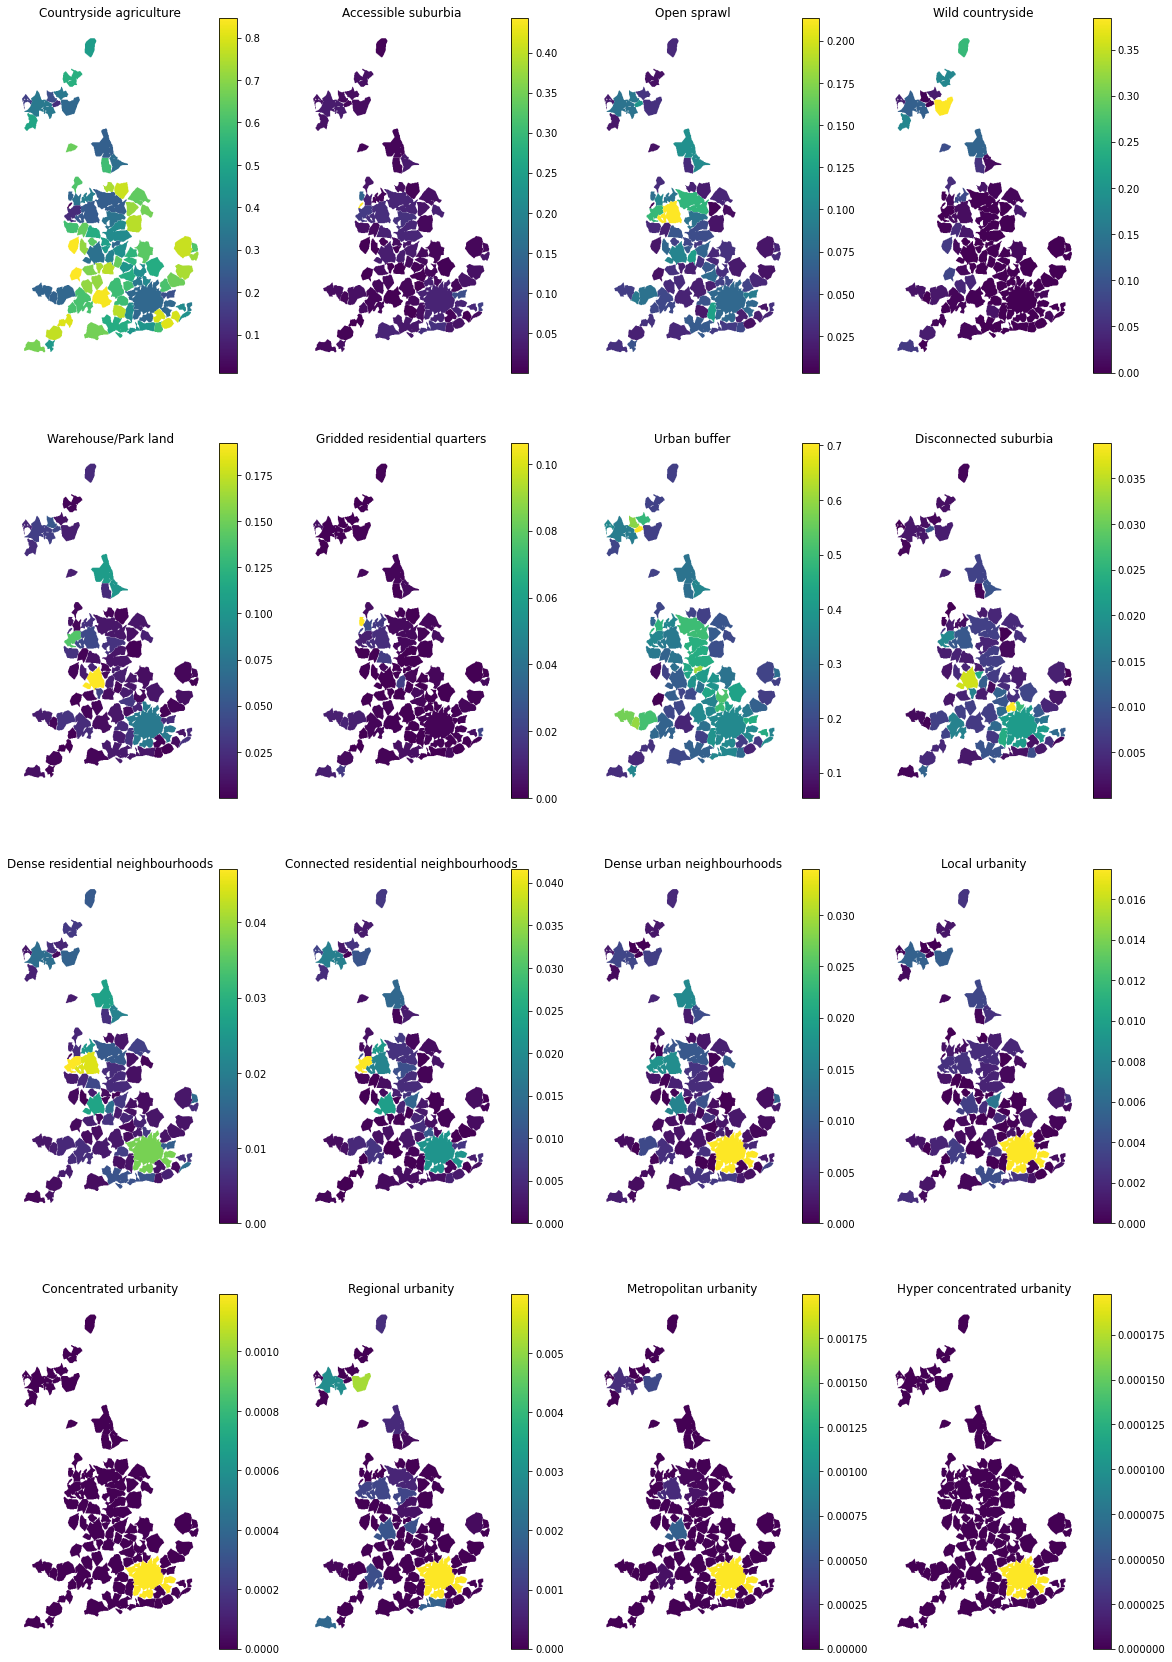
fig, axs = plt.subplots(4, 4, figsize=(20, 30))
axs = axs.flatten()
for i, sig in enumerate(plot_data.index):
    interpolated.plot(sig, ax=axs[i], legend=True)
    axs[i].axis("off")
    axs[i].set_title(sig)
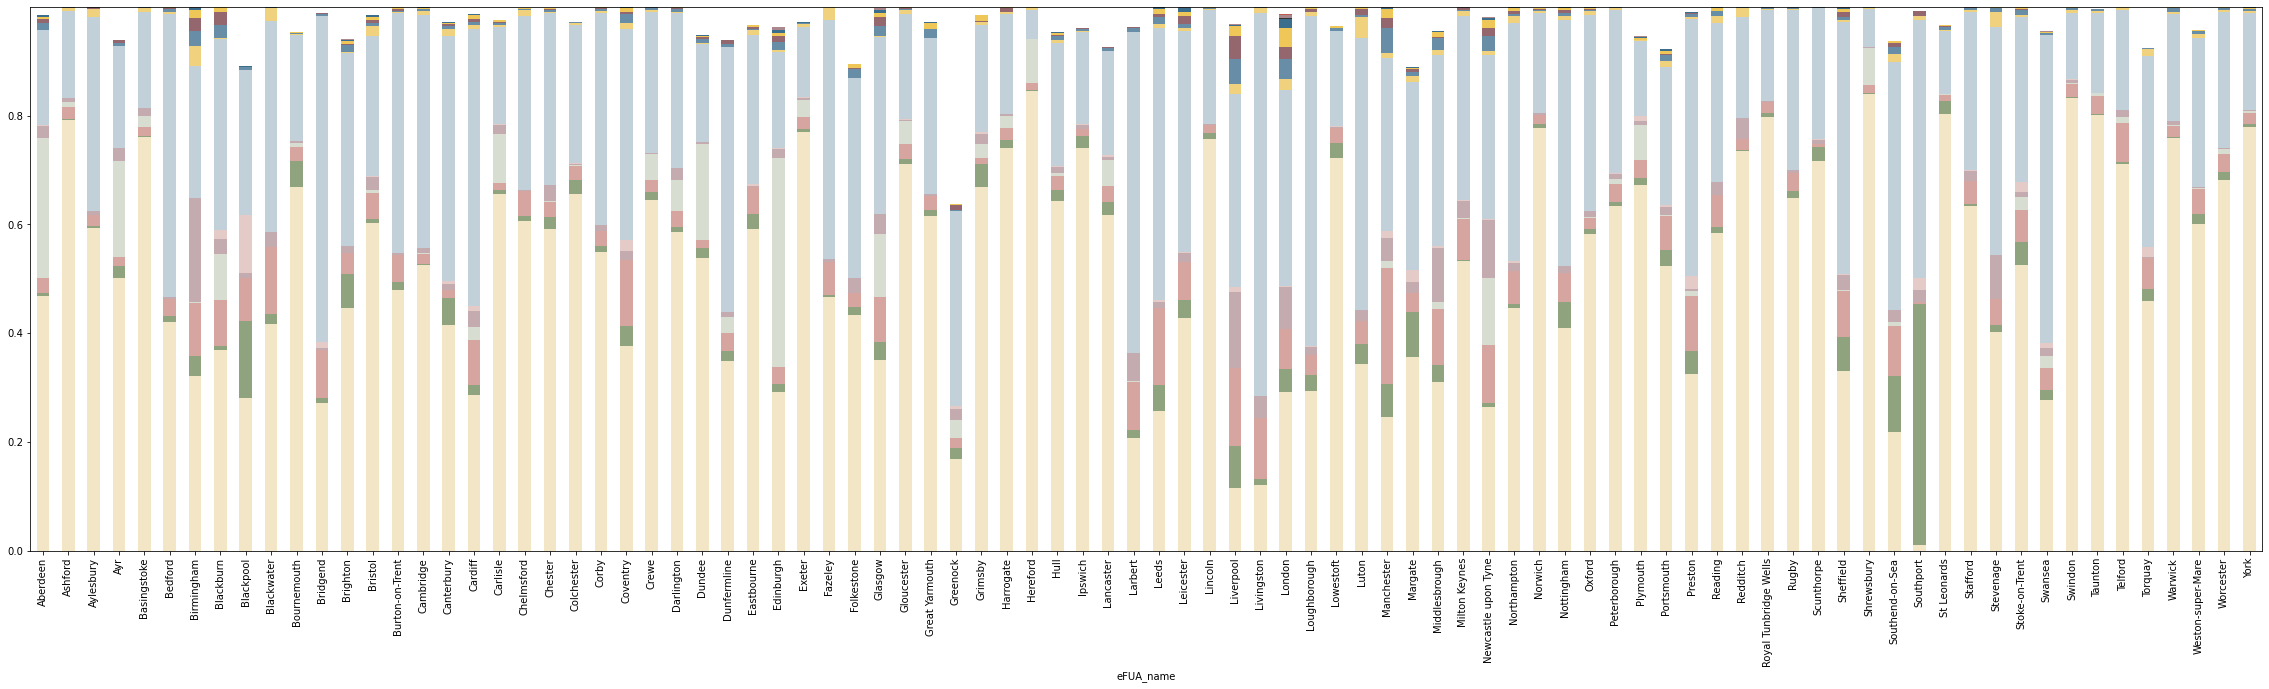
ax = plot_data.T.plot.bar(color=list(symbology.values()), stacked=True, figsize=(40, 10), legend=False)
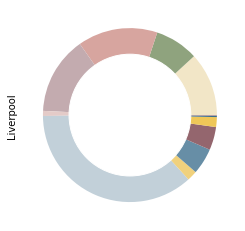
ax = plot_data["Liverpool"].plot.pie(colors=list(symbology.values()), labels=None, normalize=True)
ax.add_artist(plt.Circle((0,0), .7, color="w"))
<matplotlib.patches.Circle at 0x7f56d4675430>
plot_data
| eFUA_name | Aberdeen | Ashford | Aylesbury | Ayr | Basingstoke | Bedford | Birmingham | Blackburn | Blackpool | Blackwater | ... | Stoke-on-Trent | Swansea | Swindon | Taunton | Telford | Torquay | Warwick | Weston-super-Mare | Worcester | York |
|---|---|---|---|---|---|---|---|---|---|---|---|---|---|---|---|---|---|---|---|---|---|
| Countryside agriculture | 0.468477 | 0.792438 | 0.59436 | 0.501468 | 0.761136 | 0.420932 | 0.321044 | 0.368766 | 0.281667 | 0.41688 | ... | 0.525861 | 0.277877 | 0.833133 | 0.801086 | 0.711197 | 0.459776 | 0.758988 | 0.601651 | 0.682591 | 0.778846 |
| Accessible suburbia | 0.00522 | 0.00235 | 0.002455 | 0.022157 | 0.001093 | 0.010153 | 0.036182 | 0.007712 | 0.140768 | 0.017973 | ... | 0.04122 | 0.01743 | 0.001827 | 0.001379 | 0.003193 | 0.021057 | 0.001588 | 0.016805 | 0.014683 | 0.006016 |
| Open sprawl | 0.027675 | 0.020485 | 0.021155 | 0.016522 | 0.016944 | 0.031639 | 0.098189 | 0.083923 | 0.079557 | 0.123921 | ... | 0.05946 | 0.041449 | 0.023318 | 0.033191 | 0.07283 | 0.057665 | 0.020888 | 0.047726 | 0.032913 | 0.019338 |
| Wild countryside | 0.2571 | 0.010379 | 0.000123 | 0.176886 | 0.0201 | 0.000271 | 0.001096 | 0.085286 | 0.0 | 0.0 | ... | 0.024821 | 0.020823 | 0.001921 | 0.005899 | 0.00963 | 0.0 | 0.00115 | 0.001526 | 0.008708 | 0.005078 |
| Warehouse/Park land | 0.022771 | 0.00624 | 0.006748 | 0.024273 | 0.014514 | 0.004346 | 0.192086 | 0.026957 | 0.008568 | 0.027476 | ... | 0.008652 | 0.015282 | 0.006343 | 0.000582 | 0.013964 | 0.001896 | 0.007358 | 0.001523 | 0.002392 | 0.002115 |
| Gridded residential quarters | 0.001013 | 0.000156 | 0.0 | 0.000057 | 0.0 | 0.000029 | 0.000096 | 0.017656 | 0.106125 | 0.0 | ... | 0.018814 | 0.009396 | 0.000418 | 0.0 | 0.0 | 0.01746 | 0.000081 | 0.00027 | 0.000009 | 0.0 |
| Urban buffer | 0.175328 | 0.16147 | 0.357481 | 0.186826 | 0.177885 | 0.518984 | 0.243663 | 0.351137 | 0.268043 | 0.387318 | ... | 0.303327 | 0.565439 | 0.121925 | 0.146105 | 0.184388 | 0.352002 | 0.197949 | 0.273466 | 0.248869 | 0.177203 |
| Disconnected suburbia | 0.000592 | 0.005389 | 0.013276 | 0.00069 | 0.00634 | 0.005282 | 0.03605 | 0.001384 | 0.000172 | 0.023926 | ... | 0.002936 | 0.001013 | 0.006562 | 0.004286 | 0.004788 | 0.012217 | 0.003104 | 0.007674 | 0.003711 | 0.00422 |
| Dense residential neighbourhoods | 0.013168 | 0.001027 | 0.001616 | 0.004353 | 0.001947 | 0.004564 | 0.027543 | 0.024933 | 0.004334 | 0.002409 | ... | 0.010294 | 0.0028 | 0.003296 | 0.003498 | 0.0 | 0.002042 | 0.006854 | 0.00574 | 0.004114 | 0.002867 |
| Connected residential neighbourhoods | 0.006675 | 0.000063 | 0.002087 | 0.005485 | 0.000014 | 0.001761 | 0.023219 | 0.022438 | 0.000877 | 0.000042 | ... | 0.001383 | 0.001339 | 0.000086 | 0.000058 | 0.0 | 0.000016 | 0.000392 | 0.000041 | 0.000085 | 0.000859 |
| Dense urban neighbourhoods | 0.004019 | 0.000003 | 0.0007 | 0.000936 | 0.000027 | 0.001921 | 0.015444 | 0.009011 | 0.0 | 0.000057 | ... | 0.003226 | 0.001152 | 0.001028 | 0.001144 | 0.0 | 0.000754 | 0.001649 | 0.000464 | 0.001473 | 0.002051 |
| Local urbanity | 0.002651 | 0.0 | 0.0 | 0.00054 | 0.0 | 0.000118 | 0.003214 | 0.00074 | 0.000733 | 0.0 | ... | 0.000007 | 0.000912 | 0.000003 | 0.000005 | 0.0 | 0.000429 | 0.0 | 0.0 | 0.000454 | 0.001406 |
| Concentrated urbanity | 0.0 | 0.0 | 0.0 | 0.0 | 0.0 | 0.0 | 0.0 | 0.0 | 0.0 | 0.0 | ... | 0.0 | 0.0 | 0.0 | 0.0 | 0.0 | 0.0 | 0.0 | 0.0 | 0.0 | 0.0 |
| Regional urbanity | 0.00079 | 0.0 | 0.0 | 0.0 | 0.0 | 0.0 | 0.001571 | 0.0 | 0.0 | 0.0 | ... | 0.0 | 0.000106 | 0.0 | 0.0 | 0.0 | 0.0 | 0.0 | 0.0 | 0.0 | 0.0 |
| Metropolitan urbanity | 0.0 | 0.0 | 0.0 | 0.0 | 0.0 | 0.0 | 0.000602 | 0.0 | 0.0 | 0.0 | ... | 0.0 | 0.0 | 0.0 | 0.0 | 0.0 | 0.0 | 0.0 | 0.0 | 0.0 | 0.0 |
| Hyper concentrated urbanity | 0.0 | 0.0 | 0.0 | 0.0 | 0.0 | 0.0 | 0.0 | 0.0 | 0.0 | 0.0 | ... | 0.0 | 0.0 | 0.0 | 0.0 | 0.0 | 0.0 | 0.0 | 0.0 | 0.0 | 0.0 |
16 rows × 88 columns
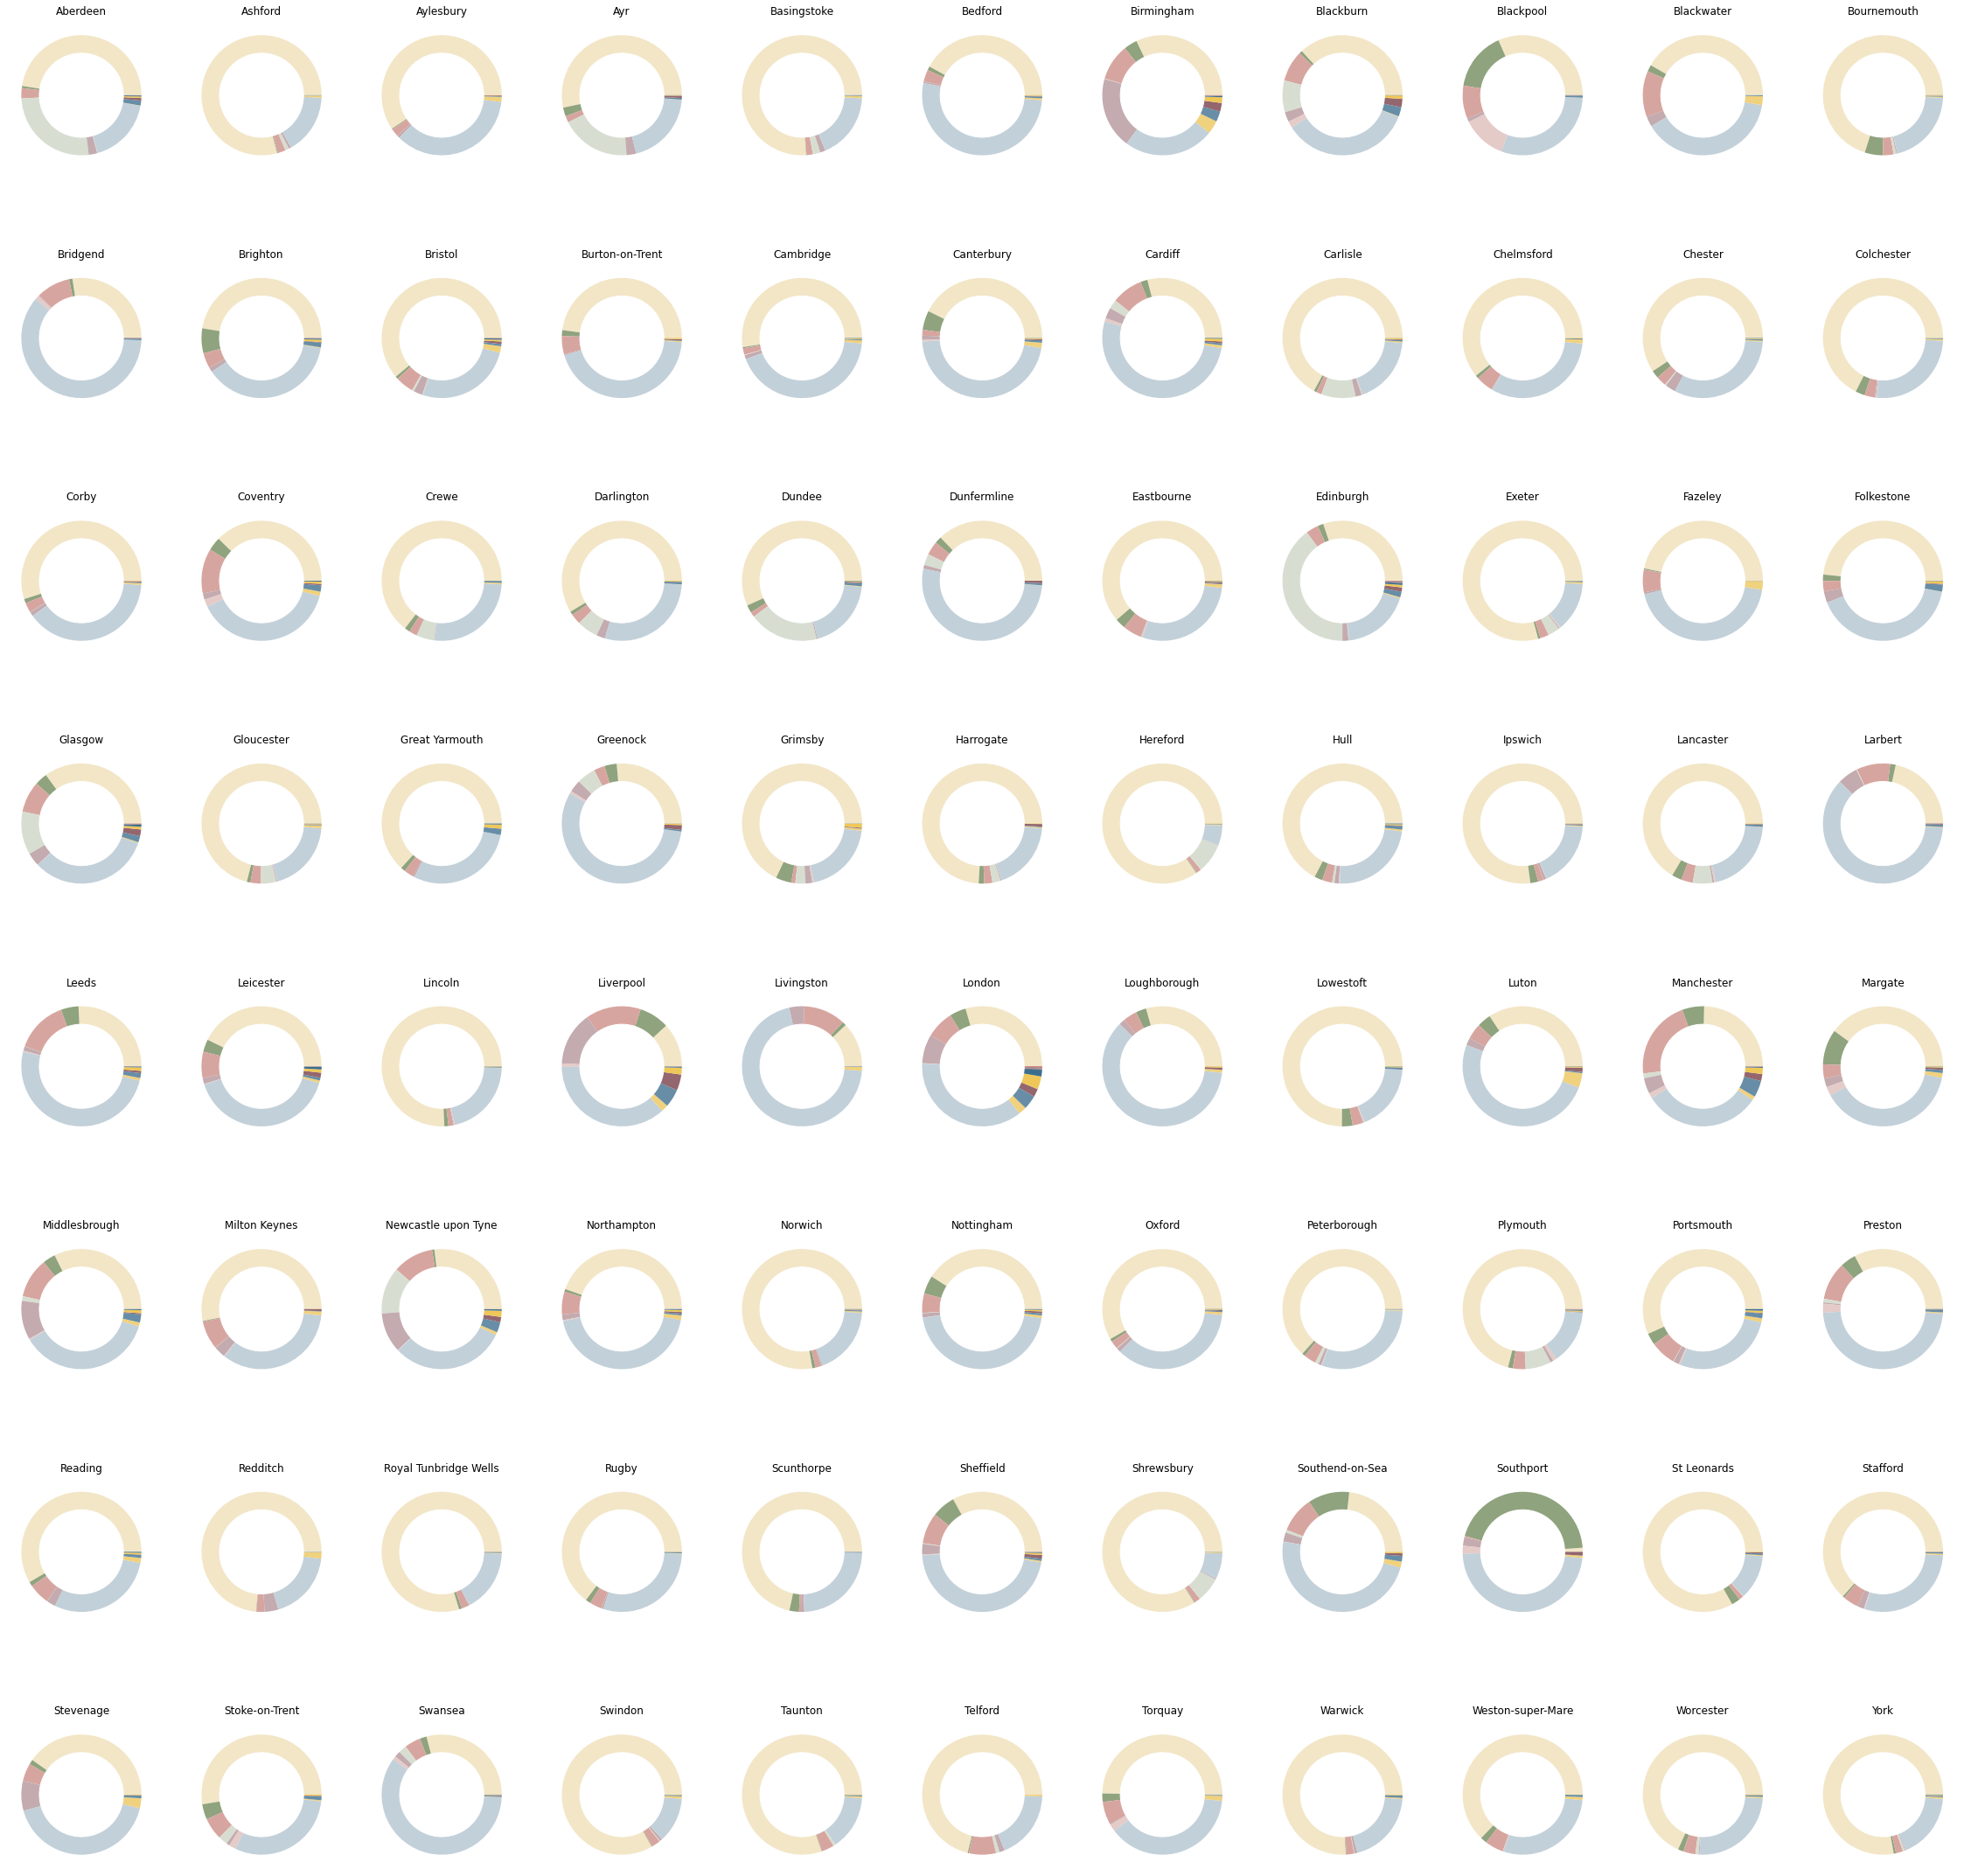
fig, axs = plt.subplots(8, 11, figsize=(40, 40))
axs = axs.flatten()
for i, place in enumerate(plot_data.columns):
    plot_data[place].plot.pie(colors=list(symbology.values()), labels=None, ax=axs[i], normalize=True)
    axs[i].axis("off")
    axs[i].add_artist(plt.Circle((0,0), .7, color="w"))
    axs[i].set_title(place)
interpolated = geopandas.read_parquet("../../urbangrammar_samba/spatial_signatures/esda/fua_interpolated.pq").set_index("eFUA_name")
plot_data = geopandas.GeoDataFrame(columns=["level", "order", "area", "urbanity", "geometry"], crs=interpolated.crs)
mapdata = interpolated.set_geometry(interpolated.centroid)

centres = ['Hyper concentrated urbanity', 'Concentrated urbanity', 'Metropolitan urbanity', 'Regional urbanity', 'Local urbanity', 'Dense urban neighbourhoods']
sizes = pandas.DataFrame()
for centre in centres:
    sizes[centre] = interpolated[centre] * interpolated.area
centroids = interpolated.centroid
for level, c in enumerate(centres):
    sub = interpolated[interpolated[c] > 0]
    area = sub.area
    sub["sorter"] = sub[c] * area
    sub = sub.sort_values("sorter", ascending=False)
    for i, ix in enumerate(sub.index):
        plot_data.loc[ix] = [level, i, sub["sorter"].loc[ix], c, centroids.loc[ix]]
    interpolated = interpolated.drop(sub.index)
/opt/conda/lib/python3.9/site-packages/geopandas/geodataframe.py:1351: SettingWithCopyWarning:
A value is trying to be set on a copy of a slice from a DataFrame.
Try using .loc[row_indexer,col_indexer] = value instead

See the caveats in the documentation: https://pandas.pydata.org/pandas-docs/stable/user_guide/indexing.html#returning-a-view-versus-a-copy
  super().__setitem__(key, value)
plot_data
| level | order | area | urbanity | geometry | |
|---|---|---|---|---|---|
| London | 0 | 0 | 1.306116e+06 | Hyper concentrated urbanity | POINT (532033.954 173151.451) |
| Birmingham | 2 | 0 | 1.075148e+06 | Metropolitan urbanity | POINT (397140.351 291249.630) |
| Edinburgh | 2 | 1 | 6.384964e+05 | Metropolitan urbanity | POINT (334233.186 662489.720) |
| Glasgow | 2 | 2 | 6.059172e+05 | Metropolitan urbanity | POINT (261190.294 661875.008) |
| Manchester | 2 | 3 | 5.153730e+05 | Metropolitan urbanity | POINT (381084.959 393574.180) |
| ... | ... | ... | ... | ... | ... |
| Dunfermline | 5 | 15 | 2.106713e+04 | Dense urban neighbourhoods | POINT (312500.311 692959.958) |
| Peterborough | 5 | 16 | 1.699622e+04 | Dense urban neighbourhoods | POINT (521163.596 300651.717) |
| Fazeley | 5 | 17 | 1.041251e+04 | Dense urban neighbourhoods | POINT (423761.509 305464.823) |
| Larbert | 5 | 18 | 4.158000e+03 | Dense urban neighbourhoods | POINT (287277.743 684585.274) |
| Ashford | 5 | 19 | 1.521635e+03 | Dense urban neighbourhoods | POINT (599356.322 137526.674) |
82 rows × 5 columns
sizes = sizes.cumsum(axis=1)
sizes
| Hyper concentrated urbanity | Concentrated urbanity | Metropolitan urbanity | Regional urbanity | Local urbanity | Dense urban neighbourhoods | |
|---|---|---|---|---|---|---|
| eFUA_name | ||||||
| Aberdeen | 0.0 | 0.0 | 0.0 | 770787.18750 | 3.357802e+06 | 7.279608e+06 |
| Ashford | 0.0 | 0.0 | 0.0 | 0.00000 | 0.000000e+00 | 1.521635e+03 |
| Aylesbury | 0.0 | 0.0 | 0.0 | 0.00000 | 0.000000e+00 | 3.482333e+05 |
| Ayr | 0.0 | 0.0 | 0.0 | 0.00000 | 4.446619e+05 | 1.215901e+06 |
| Basingstoke | 0.0 | 0.0 | 0.0 | 0.00000 | 0.000000e+00 | 2.195386e+04 |
| ... | ... | ... | ... | ... | ... | ... |
| Torquay | 0.0 | 0.0 | 0.0 | 0.00000 | 1.758806e+05 | 4.851975e+05 |
| Warwick | 0.0 | 0.0 | 0.0 | 0.00000 | 0.000000e+00 | 1.168080e+06 |
| Weston-super-Mare | 0.0 | 0.0 | 0.0 | 0.00000 | 0.000000e+00 | 2.132653e+05 |
| Worcester | 0.0 | 0.0 | 0.0 | 297.17868 | 2.893785e+05 | 1.228327e+06 |
| York | 0.0 | 0.0 | 0.0 | 0.00000 | 1.528852e+06 | 3.758643e+06 |
88 rows × 6 columns
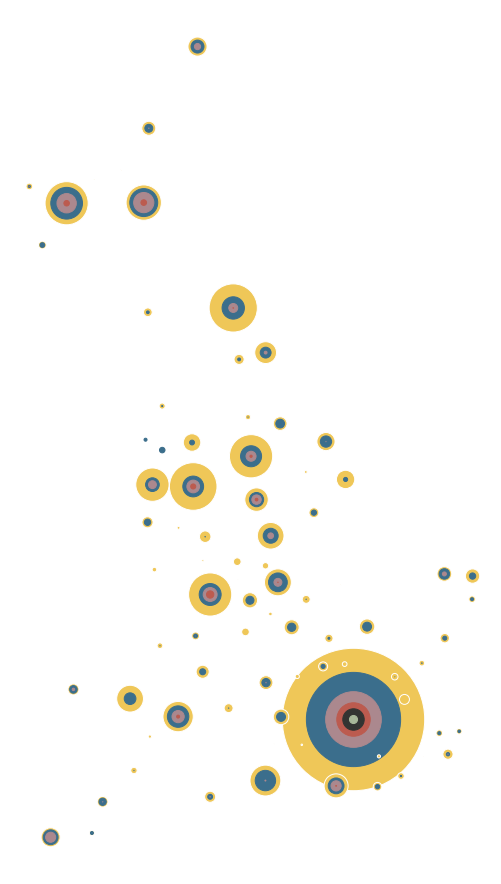
fig, ax = plt.subplots(figsize=(16, 16))
scaler = 20000

for i, centre in enumerate(centres[::-1]):
    if centre == 'Dense urban neighbourhoods':
        mapdata.drop("London").plot(markersize=sizes[centre].drop("London") / scaler, ax=ax, zorder=i+10, color=symbology[centre], edgecolor="w")
        mapdata.loc[["London"]].plot(markersize=sizes[centre].loc[["London"]] / scaler, ax=ax, zorder=i, color=symbology[centre], edgecolor="w")
    else:
        mapdata.drop("London").plot(markersize=sizes[centre].drop("London") / scaler, ax=ax, zorder=i+10, color=symbology[centre])
        mapdata.loc[["London"]].plot(markersize=sizes[centre].loc[["London"]] / scaler, ax=ax, zorder=i, color=symbology[centre])

ax.set_axis_off()
plt.savefig("figs/fua_hierarchy_map.pdf")
fig, axs = plt.subplots(1, 6, figsize=(52, 25))
scaler = 20000
axs = axs.flatten()

for i, centre in enumerate(centres[::-1]):
    mapdata.drop("London").plot(markersize=sizes[centre].drop("London") / scaler, ax=axs[i], zorder=i+10, color=symbology[centre], edgecolor="w")
    mapdata.loc[["London"]].plot(markersize=sizes[centre].loc[["London"]] / scaler, ax=axs[i], zorder=i, color=symbology[centre], edgecolor="w")

    axs[i].set_axis_off()
plt.savefig("figs/fua_hierarchy_map_layers.pdf")

plot_data
| level | order | area | urbanity | geometry | |
|---|---|---|---|---|---|
| London | 0 | 0 | 1.306116e+06 | Hyper concentrated urbanity | POINT (532033.954 173151.451) |
| Birmingham | 2 | 0 | 1.075148e+06 | Metropolitan urbanity | POINT (397140.351 291249.630) |
| Edinburgh | 2 | 1 | 6.384964e+05 | Metropolitan urbanity | POINT (334233.186 662489.720) |
| Glasgow | 2 | 2 | 6.059172e+05 | Metropolitan urbanity | POINT (261190.294 661875.008) |
| Manchester | 2 | 3 | 5.153730e+05 | Metropolitan urbanity | POINT (381084.959 393574.180) |
| ... | ... | ... | ... | ... | ... |
| Dunfermline | 5 | 15 | 2.106713e+04 | Dense urban neighbourhoods | POINT (312500.311 692959.958) |
| Peterborough | 5 | 16 | 1.699622e+04 | Dense urban neighbourhoods | POINT (521163.596 300651.717) |
| Fazeley | 5 | 17 | 1.041251e+04 | Dense urban neighbourhoods | POINT (423761.509 305464.823) |
| Larbert | 5 | 18 | 4.158000e+03 | Dense urban neighbourhoods | POINT (287277.743 684585.274) |
| Ashford | 5 | 19 | 1.521635e+03 | Dense urban neighbourhoods | POINT (599356.322 137526.674) |
82 rows × 5 columns
mapdata[["level", "order"]] = plot_data[["level", "order"]]
mapdata.order.max()
34
mapdata.loc[mapdata.level == 1, "order"] = mapdata.loc[mapdata.level == 1, "order"] * 5
mapdata.loc[mapdata.level == 2, "order"] = mapdata.loc[mapdata.level == 2, "order"] * 2.5
mapdata.loc[mapdata.level == 4, "order"] = mapdata.loc[mapdata.level == 4, "order"] * 1.5
for l in mapdata.level.dropna().unique():
    mapdata.loc[mapdata.level == l, "x"] = (mapdata.loc[mapdata.level == l, "order"] - mapdata.loc[mapdata.level == l, "order"].mean()) / mapdata.loc[mapdata.level == l, "order"].std()
mapdata.loc["London", 'x'] = 0
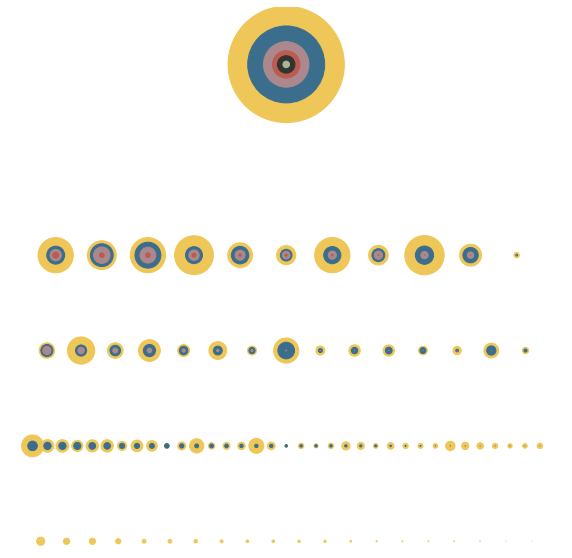
fig, ax = plt.subplots(figsize=(10, 10))
scaler = 30000

for i, centre in enumerate(centres[::-1]):
    ax.scatter(mapdata.x * 10, 1 - mapdata.level * 10, s=sizes[centre] / scaler, zorder=i+10, color=symbology[centre])

ax.set_axis_off()
# ax.axis('equal')
ax.set_ylim(-50, 7)
plt.savefig("figs/fua_hierarchy_diagram.pdf")
fig, ax = plt.subplots(figsize=(10, 10))
scaler = 30000

for i, centre in enumerate(centres[::-1]):
    ax.scatter(mapdata.loc[["London"]].x * 10, 1 - mapdata.loc[["London"]].level * 10, s=sizes.loc[["London"]][centre] / scaler, zorder=i+10, color=symbology[centre])

ax.set_axis_off()
# ax.axis('equal')
# ax.set_ylim(-42, 7)
plt.savefig("figs/fua_hierarchy_london.pdf")

interpolated = geopandas.read_parquet("../../urbangrammar_samba/spatial_signatures/esda/fua_interpolated.pq").set_index("eFUA_name")
interpolated
| Countryside agriculture | Accessible suburbia | Open sprawl | Wild countryside | Warehouse/Park land | Gridded residential quarters | Urban buffer | Disconnected suburbia | Dense residential neighbourhoods | Connected residential neighbourhoods | Dense urban neighbourhoods | Local urbanity | Concentrated urbanity | Regional urbanity | Metropolitan urbanity | Hyper concentrated urbanity | geometry | |
|---|---|---|---|---|---|---|---|---|---|---|---|---|---|---|---|---|---|
| eFUA_name | |||||||||||||||||
| Aberdeen | 0.468477 | 0.005220 | 0.027675 | 0.257100 | 0.022771 | 0.001013 | 0.175328 | 0.000592 | 0.013168 | 0.006675 | 0.004019 | 0.002651 | 0.0 | 7.899303e-04 | 0.0 | 0.0 | POLYGON ((396554.928 831071.162, 397438.641 83... |
| Ashford | 0.792438 | 0.002350 | 0.020485 | 0.010379 | 0.006240 | 0.000156 | 0.161470 | 0.005389 | 0.001027 | 0.000063 | 0.000003 | 0.000000 | 0.0 | 0.000000e+00 | 0.0 | 0.0 | POLYGON ((602189.278 150124.384, 603122.280 15... |
| Aylesbury | 0.594360 | 0.002455 | 0.021155 | 0.000123 | 0.006748 | 0.000000 | 0.357481 | 0.013276 | 0.001616 | 0.002087 | 0.000700 | 0.000000 | 0.0 | 0.000000e+00 | 0.0 | 0.0 | POLYGON ((482806.424 224230.769, 488374.430 22... |
| Ayr | 0.501468 | 0.022157 | 0.016522 | 0.176886 | 0.024273 | 0.000057 | 0.186826 | 0.000690 | 0.004353 | 0.005485 | 0.000936 | 0.000540 | 0.0 | 0.000000e+00 | 0.0 | 0.0 | POLYGON ((231195.220 644361.282, 232093.134 64... |
| Basingstoke | 0.761136 | 0.001093 | 0.016944 | 0.020100 | 0.014514 | 0.000000 | 0.177885 | 0.006340 | 0.001947 | 0.000014 | 0.000027 | 0.000000 | 0.0 | 0.000000e+00 | 0.0 | 0.0 | POLYGON ((453434.478 164656.715, 456230.544 16... |
| ... | ... | ... | ... | ... | ... | ... | ... | ... | ... | ... | ... | ... | ... | ... | ... | ... | ... |
| Torquay | 0.459776 | 0.021057 | 0.057665 | 0.000000 | 0.001896 | 0.017460 | 0.352002 | 0.012217 | 0.002042 | 0.000016 | 0.000754 | 0.000429 | 0.0 | 0.000000e+00 | 0.0 | 0.0 | POLYGON ((283655.593 77926.976, 285531.153 778... |
| Warwick | 0.758988 | 0.001588 | 0.020888 | 0.001150 | 0.007358 | 0.000081 | 0.197949 | 0.003104 | 0.006854 | 0.000392 | 0.001649 | 0.000000 | 0.0 | 0.000000e+00 | 0.0 | 0.0 | POLYGON ((436352.125 272287.416, 437276.849 27... |
| Weston-super-Mare | 0.601651 | 0.016805 | 0.047726 | 0.001526 | 0.001523 | 0.000270 | 0.273466 | 0.007674 | 0.005740 | 0.000041 | 0.000464 | 0.000000 | 0.0 | 0.000000e+00 | 0.0 | 0.0 | POLYGON ((341492.027 172229.335, 342423.543 17... |
| Worcester | 0.682591 | 0.014683 | 0.032913 | 0.008708 | 0.002392 | 0.000009 | 0.248869 | 0.003711 | 0.004114 | 0.000085 | 0.001473 | 0.000454 | 0.0 | 4.662308e-07 | 0.0 | 0.0 | POLYGON ((393165.300 255935.724, 394091.146 25... |
| York | 0.778846 | 0.006016 | 0.019338 | 0.005078 | 0.002115 | 0.000000 | 0.177203 | 0.004220 | 0.002867 | 0.000859 | 0.002051 | 0.001406 | 0.0 | 0.000000e+00 | 0.0 | 0.0 | POLYGON ((477925.637 467990.574, 478836.596 46... |
88 rows × 17 columns
for_heatmap = interpolated.drop(columns=["geometry"])
for_heatmap.T
| eFUA_name | Aberdeen | Ashford | Aylesbury | Ayr | Basingstoke | Bedford | Birmingham | Blackburn | Blackpool | Blackwater | ... | Stoke-on-Trent | Swansea | Swindon | Taunton | Telford | Torquay | Warwick | Weston-super-Mare | Worcester | York |
|---|---|---|---|---|---|---|---|---|---|---|---|---|---|---|---|---|---|---|---|---|---|
| Countryside agriculture | 0.468477 | 0.792438 | 0.594360 | 0.501468 | 0.761136 | 0.420932 | 0.321044 | 0.368766 | 0.281667 | 0.416880 | ... | 0.525861 | 0.277877 | 0.833133 | 0.801086 | 0.711197 | 0.459776 | 0.758988 | 0.601651 | 6.825910e-01 | 0.778846 |
| Accessible suburbia | 0.005220 | 0.002350 | 0.002455 | 0.022157 | 0.001093 | 0.010153 | 0.036182 | 0.007712 | 0.140768 | 0.017973 | ... | 0.041220 | 0.017430 | 0.001827 | 0.001379 | 0.003193 | 0.021057 | 0.001588 | 0.016805 | 1.468346e-02 | 0.006016 |
| Open sprawl | 0.027675 | 0.020485 | 0.021155 | 0.016522 | 0.016944 | 0.031639 | 0.098189 | 0.083923 | 0.079557 | 0.123921 | ... | 0.059460 | 0.041449 | 0.023318 | 0.033191 | 0.072830 | 0.057665 | 0.020888 | 0.047726 | 3.291301e-02 | 0.019338 |
| Wild countryside | 0.257100 | 0.010379 | 0.000123 | 0.176886 | 0.020100 | 0.000271 | 0.001096 | 0.085286 | 0.000000 | 0.000000 | ... | 0.024821 | 0.020823 | 0.001921 | 0.005899 | 0.009630 | 0.000000 | 0.001150 | 0.001526 | 8.708496e-03 | 0.005078 |
| Warehouse/Park land | 0.022771 | 0.006240 | 0.006748 | 0.024273 | 0.014514 | 0.004346 | 0.192086 | 0.026957 | 0.008568 | 0.027476 | ... | 0.008652 | 0.015282 | 0.006343 | 0.000582 | 0.013964 | 0.001896 | 0.007358 | 0.001523 | 2.391937e-03 | 0.002115 |
| Gridded residential quarters | 0.001013 | 0.000156 | 0.000000 | 0.000057 | 0.000000 | 0.000029 | 0.000096 | 0.017656 | 0.106125 | 0.000000 | ... | 0.018814 | 0.009396 | 0.000418 | 0.000000 | 0.000000 | 0.017460 | 0.000081 | 0.000270 | 9.261159e-06 | 0.000000 |
| Urban buffer | 0.175328 | 0.161470 | 0.357481 | 0.186826 | 0.177885 | 0.518984 | 0.243663 | 0.351137 | 0.268043 | 0.387318 | ... | 0.303327 | 0.565439 | 0.121925 | 0.146105 | 0.184388 | 0.352002 | 0.197949 | 0.273466 | 2.488687e-01 | 0.177203 |
| Disconnected suburbia | 0.000592 | 0.005389 | 0.013276 | 0.000690 | 0.006340 | 0.005282 | 0.036050 | 0.001384 | 0.000172 | 0.023926 | ... | 0.002936 | 0.001013 | 0.006562 | 0.004286 | 0.004788 | 0.012217 | 0.003104 | 0.007674 | 3.710574e-03 | 0.004220 |
| Dense residential neighbourhoods | 0.013168 | 0.001027 | 0.001616 | 0.004353 | 0.001947 | 0.004564 | 0.027543 | 0.024933 | 0.004334 | 0.002409 | ... | 0.010294 | 0.002800 | 0.003296 | 0.003498 | 0.000000 | 0.002042 | 0.006854 | 0.005740 | 4.114386e-03 | 0.002867 |
| Connected residential neighbourhoods | 0.006675 | 0.000063 | 0.002087 | 0.005485 | 0.000014 | 0.001761 | 0.023219 | 0.022438 | 0.000877 | 0.000042 | ... | 0.001383 | 0.001339 | 0.000086 | 0.000058 | 0.000000 | 0.000016 | 0.000392 | 0.000041 | 8.471374e-05 | 0.000859 |
| Dense urban neighbourhoods | 0.004019 | 0.000003 | 0.000700 | 0.000936 | 0.000027 | 0.001921 | 0.015444 | 0.009011 | 0.000000 | 0.000057 | ... | 0.003226 | 0.001152 | 0.001028 | 0.001144 | 0.000000 | 0.000754 | 0.001649 | 0.000464 | 1.473075e-03 | 0.002051 |
| Local urbanity | 0.002651 | 0.000000 | 0.000000 | 0.000540 | 0.000000 | 0.000118 | 0.003214 | 0.000740 | 0.000733 | 0.000000 | ... | 0.000007 | 0.000912 | 0.000003 | 0.000005 | 0.000000 | 0.000429 | 0.000000 | 0.000000 | 4.535272e-04 | 0.001406 |
| Concentrated urbanity | 0.000000 | 0.000000 | 0.000000 | 0.000000 | 0.000000 | 0.000000 | 0.000000 | 0.000000 | 0.000000 | 0.000000 | ... | 0.000000 | 0.000000 | 0.000000 | 0.000000 | 0.000000 | 0.000000 | 0.000000 | 0.000000 | 0.000000e+00 | 0.000000 |
| Regional urbanity | 0.000790 | 0.000000 | 0.000000 | 0.000000 | 0.000000 | 0.000000 | 0.001571 | 0.000000 | 0.000000 | 0.000000 | ... | 0.000000 | 0.000106 | 0.000000 | 0.000000 | 0.000000 | 0.000000 | 0.000000 | 0.000000 | 4.662308e-07 | 0.000000 |
| Metropolitan urbanity | 0.000000 | 0.000000 | 0.000000 | 0.000000 | 0.000000 | 0.000000 | 0.000602 | 0.000000 | 0.000000 | 0.000000 | ... | 0.000000 | 0.000000 | 0.000000 | 0.000000 | 0.000000 | 0.000000 | 0.000000 | 0.000000 | 0.000000e+00 | 0.000000 |
| Hyper concentrated urbanity | 0.000000 | 0.000000 | 0.000000 | 0.000000 | 0.000000 | 0.000000 | 0.000000 | 0.000000 | 0.000000 | 0.000000 | ... | 0.000000 | 0.000000 | 0.000000 | 0.000000 | 0.000000 | 0.000000 | 0.000000 | 0.000000 | 0.000000e+00 | 0.000000 |
16 rows × 88 columns
import seaborn as sns
import matplotlib.pyplot as plt
from matplotlib.colors import LogNorm
import numpy as np
order = ['Wild countryside', 'Countryside agriculture', 'Urban buffer',
       'Warehouse/Park land', 'Open sprawl', 'Disconnected suburbia',
       'Accessible suburbia', 'Connected residential neighbourhoods',
       'Dense residential neighbourhoods', 'Gridded residential quarters',
       'Dense urban neighbourhoods', 'Local urbanity', 'Regional urbanity',
       'Metropolitan urbanity', 'Concentrated urbanity',
       'Hyper concentrated urbanity'
    ]
order.reverse()
for_heatmap = for_heatmap[
    order
]
plot_data2 = geopandas.GeoDataFrame(columns=["level", "order", "area", "urbanity", "geometry"], crs=interpolated.crs)
sizes = pandas.DataFrame()
for centre in order:
    sizes[centre] = interpolated[centre] * interpolated.area
centroids = interpolated.centroid
for level, c in enumerate(order):
    sub = interpolated[interpolated[c] > 0]
    area = sub.area
    sub["sorter"] = sub[c] * area
    sub = sub.sort_values("sorter", ascending=False)
    for i, ix in enumerate(sub.index):
        plot_data2.loc[ix] = [level, i, sub["sorter"].loc[ix], c, centroids.loc[ix]]
    interpolated = interpolated.drop(sub.index)
/opt/conda/lib/python3.9/site-packages/geopandas/geodataframe.py:1351: SettingWithCopyWarning:
A value is trying to be set on a copy of a slice from a DataFrame.
Try using .loc[row_indexer,col_indexer] = value instead

See the caveats in the documentation: https://pandas.pydata.org/pandas-docs/stable/user_guide/indexing.html#returning-a-view-versus-a-copy
  super().__setitem__(key, value)
/opt/conda/lib/python3.9/site-packages/geopandas/geodataframe.py:1351: SettingWithCopyWarning:
A value is trying to be set on a copy of a slice from a DataFrame.
Try using .loc[row_indexer,col_indexer] = value instead

See the caveats in the documentation: https://pandas.pydata.org/pandas-docs/stable/user_guide/indexing.html#returning-a-view-versus-a-copy
  super().__setitem__(key, value)
/opt/conda/lib/python3.9/site-packages/geopandas/geodataframe.py:1351: SettingWithCopyWarning:
A value is trying to be set on a copy of a slice from a DataFrame.
Try using .loc[row_indexer,col_indexer] = value instead

See the caveats in the documentation: https://pandas.pydata.org/pandas-docs/stable/user_guide/indexing.html#returning-a-view-versus-a-copy
  super().__setitem__(key, value)
/opt/conda/lib/python3.9/site-packages/geopandas/geodataframe.py:1351: SettingWithCopyWarning:
A value is trying to be set on a copy of a slice from a DataFrame.
Try using .loc[row_indexer,col_indexer] = value instead

See the caveats in the documentation: https://pandas.pydata.org/pandas-docs/stable/user_guide/indexing.html#returning-a-view-versus-a-copy
  super().__setitem__(key, value)
/opt/conda/lib/python3.9/site-packages/geopandas/geodataframe.py:1351: SettingWithCopyWarning:
A value is trying to be set on a copy of a slice from a DataFrame.
Try using .loc[row_indexer,col_indexer] = value instead

See the caveats in the documentation: https://pandas.pydata.org/pandas-docs/stable/user_guide/indexing.html#returning-a-view-versus-a-copy
  super().__setitem__(key, value)
plot_data2
| level | order | area | urbanity | geometry | |
|---|---|---|---|---|---|
| London | 0 | 0 | 1.306116e+06 | Hyper concentrated urbanity | POINT (532033.954 173151.451) |
| Birmingham | 2 | 0 | 1.075148e+06 | Metropolitan urbanity | POINT (397140.351 291249.630) |
| Edinburgh | 2 | 1 | 6.384964e+05 | Metropolitan urbanity | POINT (334233.186 662489.720) |
| Glasgow | 2 | 2 | 6.059172e+05 | Metropolitan urbanity | POINT (261190.294 661875.008) |
| Manchester | 2 | 3 | 5.153730e+05 | Metropolitan urbanity | POINT (381084.959 393574.180) |
| ... | ... | ... | ... | ... | ... |
| Southport | 6 | 1 | 1.509241e+06 | Gridded residential quarters | POINT (333927.344 415055.653) |
| Milton Keynes | 6 | 2 | 1.498690e+06 | Gridded residential quarters | POINT (480860.358 238237.828) |
| Livingston | 7 | 0 | 3.344023e+05 | Dense residential neighbourhoods | POINT (300947.283 668289.615) |
| Redditch | 7 | 1 | 3.083904e+05 | Dense residential neighbourhoods | POINT (407756.075 259980.966) |
| Telford | 9 | 0 | 1.706188e+06 | Accessible suburbia | POINT (368072.809 310363.598) |
88 rows × 5 columns
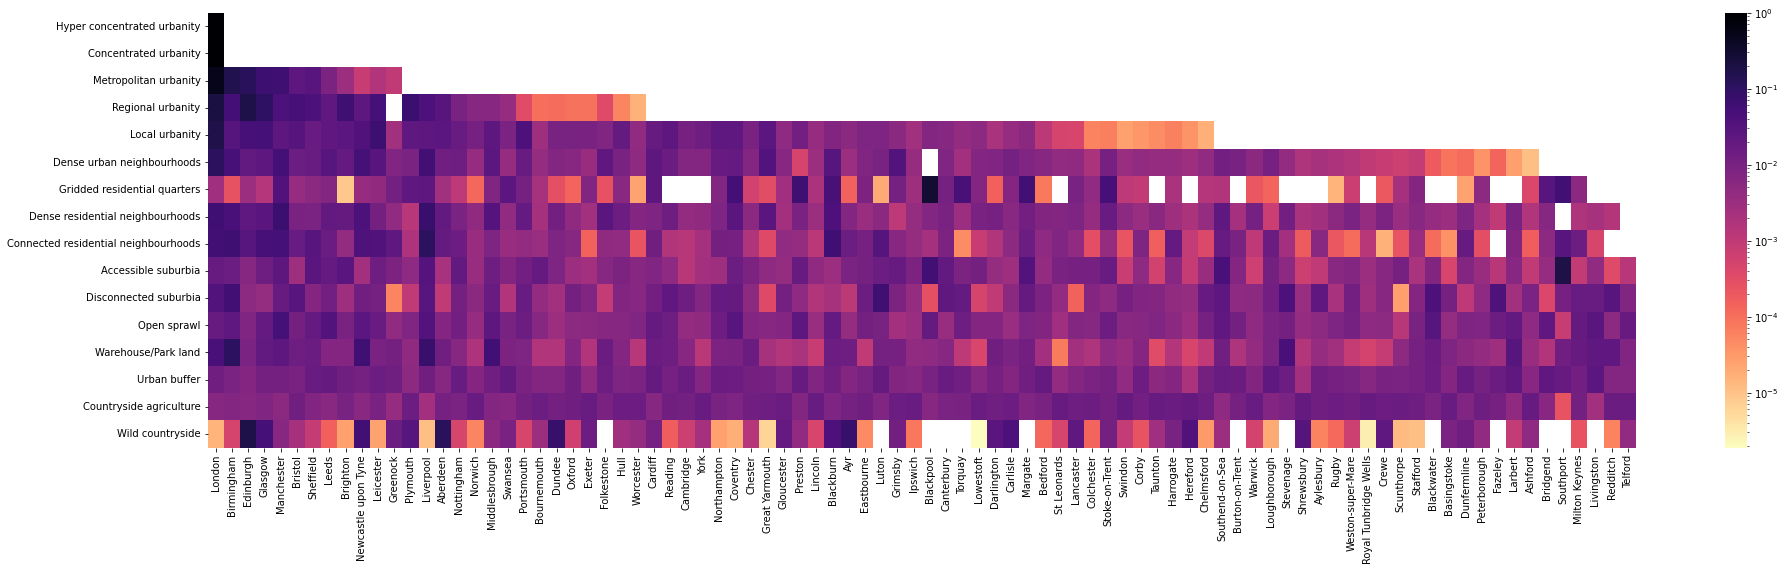
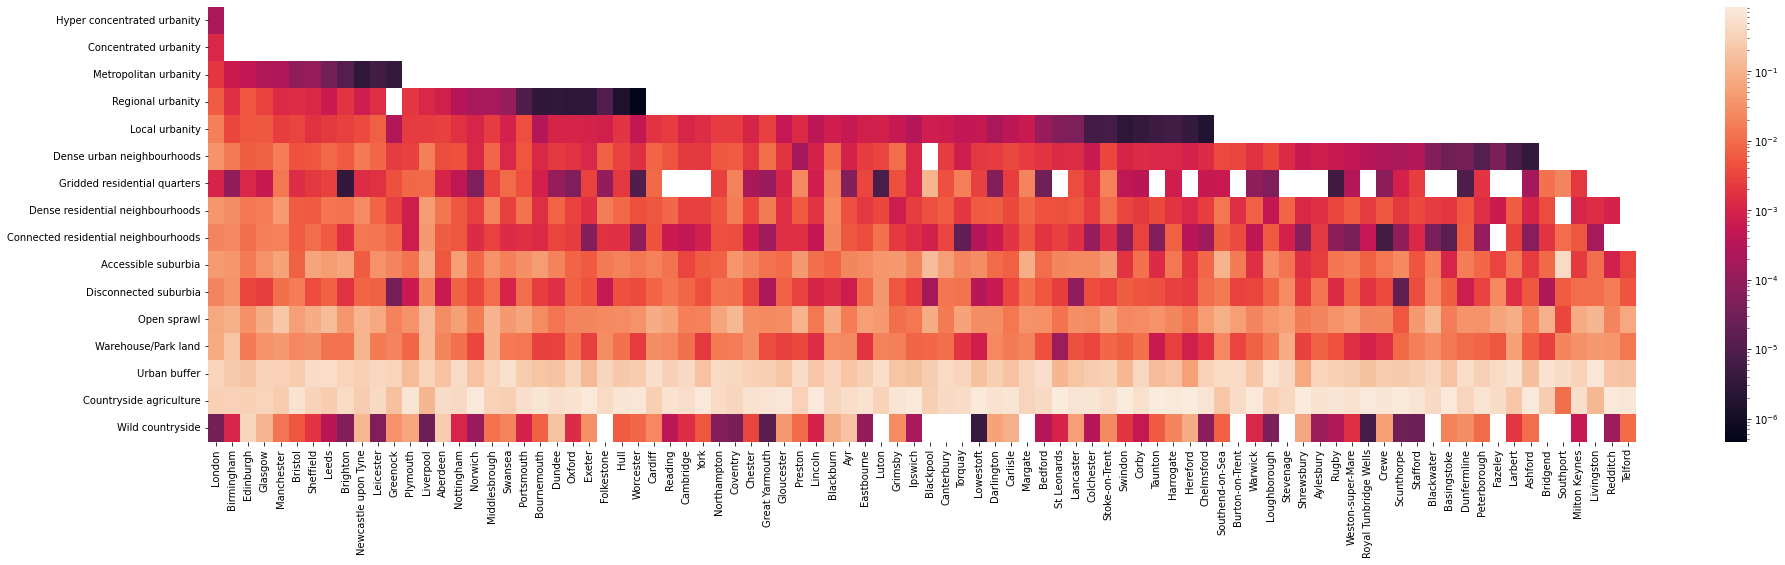
Per proportion within TTWA
plt.subplots(figsize=(32, 8))
sns.heatmap(data=for_heatmap.loc[plot_data2.index].T, norm=LogNorm())
<AxesSubplot:>
Per proportion of type within ttwa
plt.subplots(figsize=(32, 8))
sns.heatmap(data=(for_heatmap / for_heatmap.sum(axis=0)).loc[plot_data2.index].T, norm=LogNorm())
<AxesSubplot:>
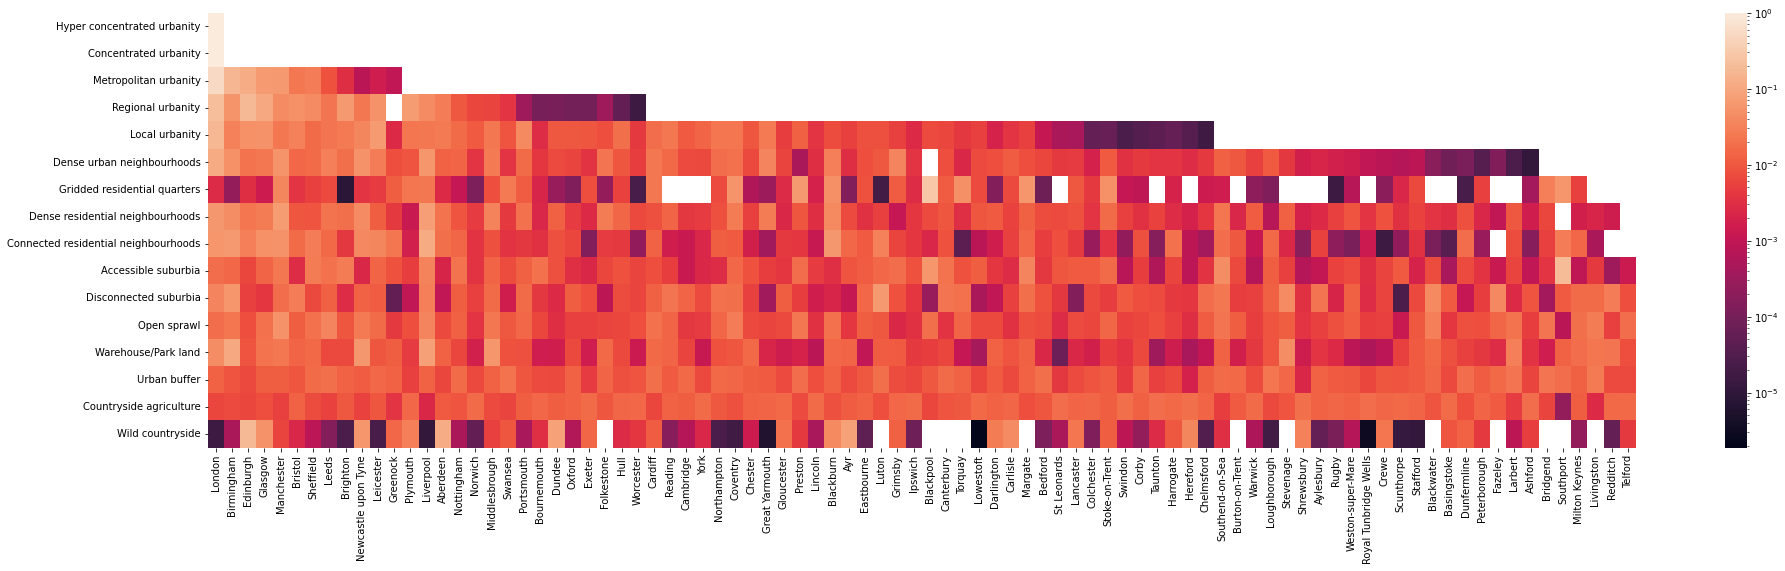
plt.subplots(figsize=(32, 8))
sns.heatmap(data=(for_heatmap / for_heatmap.sum(axis=0)).loc[plot_data2.index].T, norm=LogNorm(), cmap="magma_r")
<AxesSubplot:>